Article 28 of the Basics course found the N+1 problem with ten orders and eleven SELECT statements, and fixed it with JOIN FETCH and @EntityGraph. That was the easy version: one collection, no paging, no product names. A real order list pages through 200 orders, prints the product on every line, and has to stay fast after the next developer adds a field to the response. At that size the fix needs three things the Basics course did not have: a way to count statements per request that a test can assert on, fetching strategies that survive paging, and a way to stop loading entities when the endpoint only needs five columns. Writing data has its own version of the problem, where the key generator quietly decides whether 10,000 rows cost 10,000 round trips.
The examples use Spring Boot 4.1.1 (which ships Hibernate 7) and Java 21, against PostgreSQL 18. H2 would hide exactly the costs this article measures, so nothing here runs on it. Most JPA performance advice online describes Hibernate 5, and several of the results below contradict it.
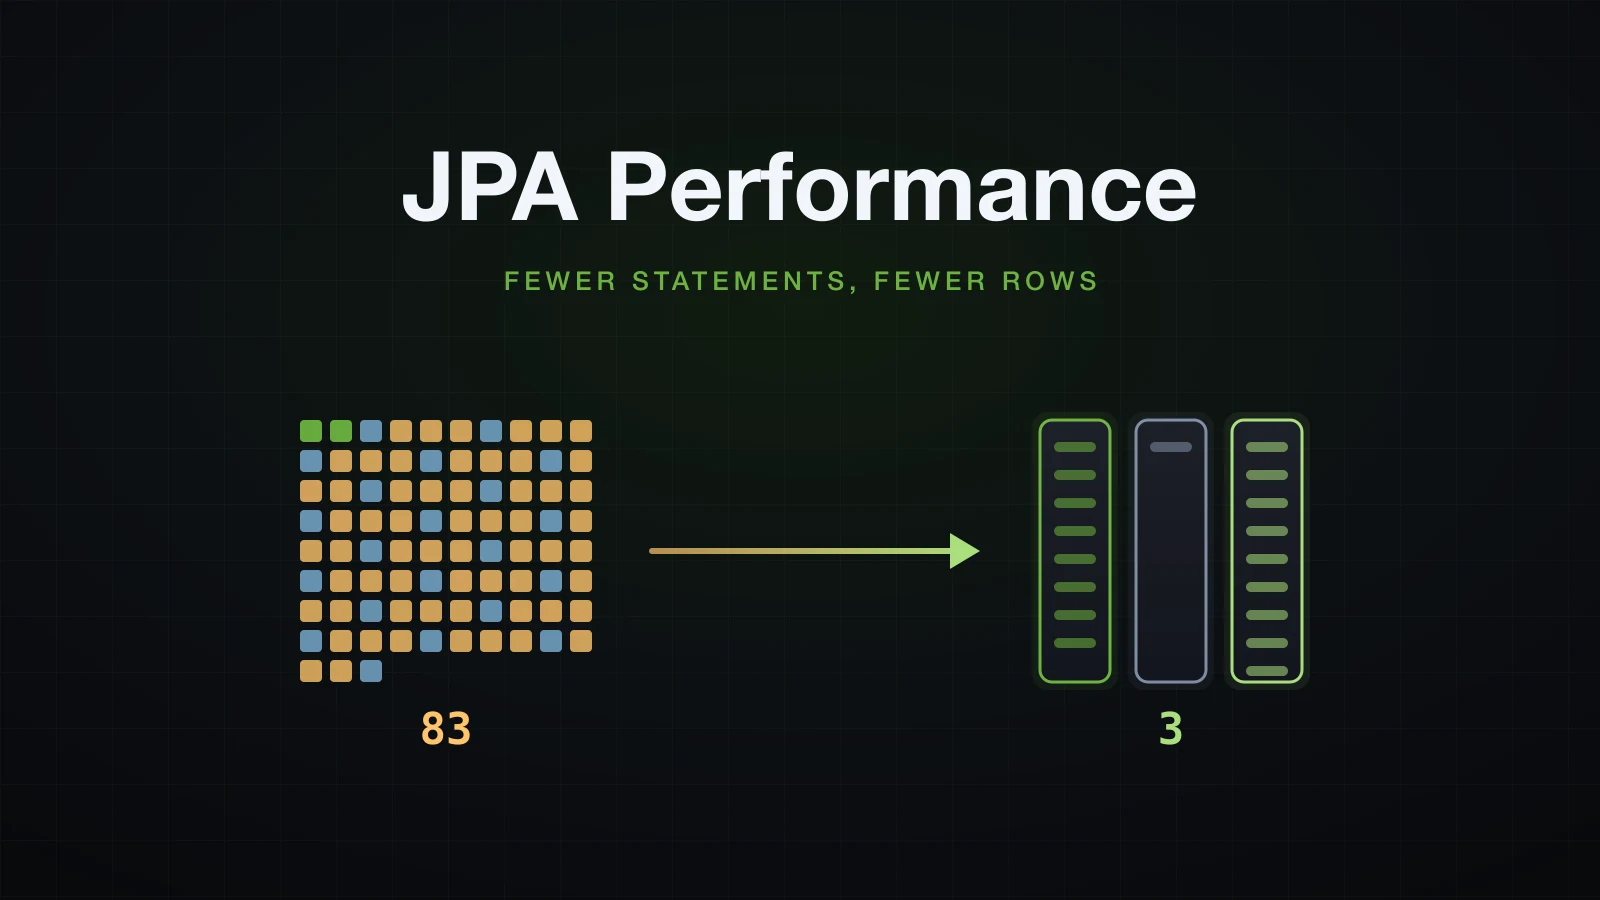
The article moves from seeing the queries, to reading fewer rows, to writing many rows.
The data set and how the statements were counted
Project, database and settings
curl -s "https://start.spring.io/starter.zip?type=gradle-project&language=java&bootVersion=4.1.1&javaVersion=21&groupId=com.example&artifactId=demo&name=demo&packageName=com.example.demo&dependencies=web,data-jpa,postgresql,flyway" -o demo.zipThe database runs with pg_stat_statements, PostgreSQL's own record of every statement it executed and how many rows each returned. It is the second counter this article uses, independent of anything Hibernate reports:
docker run -d --name sba-a5-pg -e POSTGRES_USER=demo -e POSTGRES_PASSWORD=demo -e POSTGRES_DB=demo -p 5505:5432 postgres:18 -c shared_preload_libraries=pg_stat_statements -c pg_stat_statements.track=alldocker exec sba-a5-pg psql -U demo -d demo -c "create extension pg_stat_statements"spring.application.name=demo
server.port=8205
spring.datasource.url=jdbc:postgresql://localhost:5505/demo
spring.datasource.username=demo
spring.datasource.password=demo
spring.jpa.hibernate.ddl-auto=validate
spring.jpa.open-in-view=false
logging.level.org.hibernate.SQL=debugFlyway owns the schema and Hibernate only validates it, as in the Basics course. The tables are the catalogue and orders from article 28, with identity keys for now:
create table categories (
    id   bigint generated by default as identity primary key,
    name varchar(80) not null unique
);

create table products (
    id          bigint generated by default as identity primary key,
    name        varchar(120)   not null,
    sku         varchar(40)    not null unique,
    price       numeric(10, 2) not null,
    category_id bigint         not null references categories (id)
);
create index products_category_id_idx on products (category_id);

create table customers (
    id    bigint generated by default as identity primary key,
    email varchar(120) not null unique,
    name  varchar(120) not null
);

create table orders (
    id          bigint generated by default as identity primary key,
    customer_id bigint                   not null references customers (id),
    placed_at   timestamp with time zone not null
);
create index orders_customer_id_idx on orders (customer_id);

create table order_lines (
    id         bigint generated by default as identity primary key,
    order_id   bigint         not null references orders (id),
    product_id bigint         not null references products (id),
    quantity   integer        not null,
    unit_price numeric(10, 2) not null
);
create index order_lines_order_id_idx on order_lines (order_id);
The seed is deterministic, so every run reads the same rows:
insert into categories (name)
values ('Keyboards'), ('Mice'), ('Monitors'), ('Headsets'), ('Webcams'), ('Cables'), ('Storage'), ('Chairs');

-- 100 products, spread over the 8 categories
insert into products (name, sku, price, category_id)
select (array ['Keyboard', 'Mouse', 'Monitor', 'Headset', 'Webcam', 'Cable', 'SSD', 'Chair'])[1 + (g - 1) % 8]
           || ' ' || lpad(((g - 1) / 8 + 1)::text, 2, '0'),
       'SKU-' || lpad(g::text, 4, '0'),
       9.90 + (g * 37) % 400,
       1 + (g - 1) % 8
from generate_series(1, 100) as g;

-- 50 customers
insert into customers (email, name)
select 'customer' || lpad(g::text, 2, '0') || '@example.com', 'Customer ' || lpad(g::text, 2, '0')
from generate_series(1, 50) as g;

-- 200 orders
insert into orders (customer_id, placed_at)
select 1 + (g - 1) % 50, timestamptz '2026-01-01 08:00:00+00' + g * interval '7 hours'
from generate_series(1, 200) as g;

-- 3 to 5 lines per order
insert into order_lines (order_id, product_id, quantity, unit_price)
select o.id, p.id, 1 + (o.id + n) % 4, p.price
from orders o
         cross join lateral generate_series(1, 3 + o.id % 3) as n
         join products p on p.id = 1 + (o.id * 7 + n * 31) % 100
order by o.id, n;
That gives 8 categories, 100 products, 50 customers, 200 orders and 801 order lines. The page every measurement reads is page 3 of 20 orders sorted by id: orders 61 to 80, with 81 lines that point at 61 different products.
The entities and the endpoint
The mappings are the ones article 28 of the Basics course settled on: every @ManyToOne is LAZY with optional = false, and Order.lines is the inverse side of OrderLine.order:
@Entity
@Table(name = "orders")
public class Order {

    @Id
    @GeneratedValue(strategy = GenerationType.IDENTITY)
    private Long id;

    @ManyToOne(fetch = FetchType.LAZY, optional = false)
    @JoinColumn(name = "customer_id", nullable = false)
    private Customer customer;

    @Column(nullable = false)
    private Instant placedAt;

    @OneToMany(mappedBy = "order", cascade = CascadeType.ALL, orphanRemoval = true)
    private List<OrderLine> lines = new ArrayList<>();

    // constructor, addLine(OrderLine), total() and getters as in the Basics course
}@Entity
@Table(name = "order_lines")
public class OrderLine {
@Id
@GeneratedValue(strategy = GenerationType.IDENTITY)
private Long id;
@ManyToOne(fetch = FetchType.LAZY, optional = false)
@JoinColumn(name = "order_id", nullable = false)
private Order order;
@ManyToOne(fetch = FetchType.LAZY, optional = false)
@JoinColumn(name = "product_id", nullable = false)
private Product product;
@Column(nullable = false)
private int quantity;
@Column(nullable = false, precision = 10, scale = 2)
private BigDecimal unitPrice;
// constructor, lineTotal() and getters
}Product has id, name, sku, price and a lazy category. The response carries the product name on every line, which is what makes the endpoint realistic and what makes it expensive:
package com.example.demo.order;

import java.math.BigDecimal;
import java.time.Instant;
import java.util.List;

public record OrderResponse(Long id, Instant placedAt, List<LineResponse> lines, BigDecimal total) {

    public record LineResponse(String product, int quantity, BigDecimal unitPrice) {

        static LineResponse from(OrderLine line) {
            return new LineResponse(line.getProduct().getName(), line.getQuantity(), line.getUnitPrice());
        }
    }

    public static OrderResponse from(Order order) {
        return new OrderResponse(order.getId(), order.getPlacedAt(),
                order.getLines().stream().map(LineResponse::from).toList(), order.total());
    }
}
The service maps inside its transaction, because open-in-view is off, and returns the PageResponse record from article 29 of the Basics course:
@Transactional(readOnly = true)
public PageResponse<OrderResponse> findPage(Pageable pageable) {
    return PageResponse.from(orders.findAll(pageable).map(OrderResponse::from));
}@GetMapping
public PageResponse<OrderResponse> findPage(@PageableDefault(size = 20, sort = "id") Pageable pageable) {
return service.findPage(pageable);
}Seeing the queries: counting SQL statements per request
What the SQL log shows
curl -s 'http://localhost:8205/api/orders?page=3&size=20'The first lines Hibernate logged for that request, cut down to the message:
select o1_0.id,o1_0.customer_id,o1_0.placed_at from orders o1_0 order by o1_0.id offset ? rows fetch first ? rows only
select count(o1_0.id) from orders o1_0
select l1_0.order_id,l1_0.id,l1_0.product_id,l1_0.quantity,l1_0.unit_price from order_lines l1_0 where l1_0.order_id=?
select p1_0.id,p1_0.category_id,p1_0.name,p1_0.price,p1_0.sku from products p1_0 where p1_0.id=?
select p1_0.id,p1_0.category_id,p1_0.name,p1_0.price,p1_0.sku from products p1_0 where p1_0.id=?
select p1_0.id,p1_0.category_id,p1_0.name,p1_0.price,p1_0.sku from products p1_0 where p1_0.id=?
select p1_0.id,p1_0.category_id,p1_0.name,p1_0.price,p1_0.sku from products p1_0 where p1_0.id=?
select l1_0.order_id,l1_0.id,l1_0.product_id,l1_0.quantity,l1_0.unit_price from order_lines l1_0 where l1_0.order_id=?
This is article 28's N+1 twice over: one SELECT of lines per order, and inside each order one SELECT per product not yet in the persistence context. Scrolling a log is no way to count, so PostgreSQL counted. select pg_stat_statements_reset() before the request, then:
select calls, rows, query from pg_stat_statements where query not ilike '%pg_stat_statements%' order by query; calls | rows | query
-------+------+--------------------------------------------------------------------------------------------------------------------------
1 | 1 | select count(o1_0.id) from orders o1_0
20 | 81 | select l1_0.order_id,l1_0.id,l1_0.product_id,l1_0.quantity,l1_0.unit_price from order_lines l1_0 where l1_0.order_id=$1
1 | 20 | select o1_0.id,o1_0.customer_id,o1_0.placed_at from orders o1_0 order by o1_0.id offset $1 rows fetch first $2 rows only
61 | 61 | select p1_0.id,p1_0.category_id,p1_0.name,p1_0.price,p1_0.sku from products p1_0 where p1_0.id=$183 statements and 163 rows for one page: 1 page query, 1 count, 20 line queries and 61 product queries. pg_stat_statements is the ground truth for a lab, but it is server-wide, so it cannot tell two requests apart. The application has to count too.
generate_statistics and the session metrics log in Hibernate 7
The advice that fills search results is spring.jpa.properties.hibernate.generate_statistics=true, with a Session Metrics block for every session as the promised output. With Hibernate 7.4.5, that property alone logged nothing for this request. It enables the statistics API, and with logging.level.org.hibernate.statistics=debug it logs one line per query:
DEBUG org.hibernate.statistics : HHH000117: Query: [CRITERIA] select o1_0.id,o1_0.customer_id,o1_0.placed_at from orders o1_0 order by o1_0.id offset ? rows fetch first ? rows only, time: 13ms, rows: 20
DEBUG org.hibernate.statistics : HHH000117: Query: [CRITERIA] select count(o1_0.id) from orders o1_0, time: 0ms, rows: 1
Two lines for 83 statements. The 81 lazy loads are not queries, so the query statistics never see them: the N+1 is invisible exactly where people look for it. The per-session block moved to its own log category in Hibernate 7. The old switch, hibernate.session.events.log, is marked in SessionEventSettings as deprecated and "now ignored", and its Javadoc names the replacement:
logging.level.org.hibernate.session.metrics=debug With that alone, and no generate_statistics, the request logged:
DEBUG org.hibernate.session.metrics : HHH000401: Logging session metrics:
	29833 ns acquiring 1 JDBC connections
	0 ns releasing 0 JDBC connections
	613495 ns preparing 83 JDBC statements
	24739799 ns executing 83 JDBC statements
	0 ns executing 0 JDBC batches
	0 ns performing 0 second-level cache puts
	0 ns performing 0 second-level cache hits
	0 ns performing 0 second-level cache misses
	0 ns executing 0 flushes (flushing a total of 0 entities and 0 collections)
	72709 ns executing 2 pre-partial-flushes
	71125 ns executing 2 partial-flushes (flushing a total of 0 entities and 0 collections)
83 statements, matching PostgreSQL. The block is per session, logged when the session closes, and it is the quickest way to read a request's cost during development. It cannot be asserted in a test, though, and on a busy server the blocks of concurrent requests interleave.
A StatementInspector that counts SQL per request
Hibernate passes every SQL string it prepares through a StatementInspector before sending it. One that records the strings in a ThreadLocal gives a per-thread count, and with open-in-view off every statement of a request runs on the request's thread:
package com.example.demo.common;

import java.util.ArrayList;
import java.util.List;

import org.hibernate.resource.jdbc.spi.StatementInspector;

public class SqlStatementCounter implements StatementInspector {

    private static final ThreadLocal<List<String>> STATEMENTS = new ThreadLocal<>();

    @Override
    public String inspect(String sql) {
        List<String> statements = STATEMENTS.get();
        if (statements != null) {
            statements.add(sql);
        }
        return sql;
    }

    public static void start() {
        STATEMENTS.set(new ArrayList<>());
    }

    public static List<String> stop() {
        List<String> statements = STATEMENTS.get();
        STATEMENTS.remove();
        return statements == null ? List.of() : statements;
    }
}
Spring Boot hands Hibernate an instance through a HibernatePropertiesCustomizer, which lives in org.springframework.boot.hibernate.autoconfigure in Boot 4:
package com.example.demo.common;

import org.hibernate.cfg.AvailableSettings;
import org.springframework.boot.hibernate.autoconfigure.HibernatePropertiesCustomizer;
import org.springframework.context.annotation.Bean;
import org.springframework.context.annotation.Configuration;

@Configuration
class JpaConfig {

    @Bean
    HibernatePropertiesCustomizer statementCounter() {
        return properties -> properties.put(AvailableSettings.STATEMENT_INSPECTOR, new SqlStatementCounter());
    }
}
A servlet filter opens and closes the count around each request, logs it, and leaves the statements on the request for a test to read:
package com.example.demo.common;

import java.io.IOException;
import java.util.List;

import jakarta.servlet.FilterChain;
import jakarta.servlet.ServletException;
import jakarta.servlet.http.HttpServletRequest;
import jakarta.servlet.http.HttpServletResponse;

import org.slf4j.Logger;
import org.slf4j.LoggerFactory;
import org.springframework.stereotype.Component;
import org.springframework.web.filter.OncePerRequestFilter;

@Component
public class SqlCountingFilter extends OncePerRequestFilter {

    public static final String STATEMENTS = SqlCountingFilter.class.getName() + ".statements";

    private static final Logger log = LoggerFactory.getLogger(SqlCountingFilter.class);

    @Override
    protected void doFilterInternal(HttpServletRequest request, HttpServletResponse response, FilterChain chain)
            throws ServletException, IOException {
        SqlStatementCounter.start();
        try {
            chain.doFilter(request, response);
        } finally {
            List<String> statements = SqlStatementCounter.stop();
            request.setAttribute(STATEMENTS, statements);
            String query = request.getQueryString() == null ? "" : "?" + request.getQueryString();
            log.info("{} {}{} -> {} SQL statements", request.getMethod(), request.getRequestURI(), query,
                    statements.size());
        }
    }
}INFO c.example.demo.common.SqlCountingFilter : GET /api/orders?page=3&size=20 -> 83 SQL statementsThe inspector saw the same 83 statements as the session metrics and as PostgreSQL. It sees SQL strings, not what the driver does with them, so for batched INSERTs the last part of this article reads the session metrics and pg_stat_statements instead.
An integration test that fails on N+1
The counter becomes useful when it guards the endpoint. The test calls it through MockMvc, whose filter chain includes SqlCountingFilter, and asserts on the statements the filter left on the request:
package com.example.demo.order;

import static org.assertj.core.api.Assertions.assertThat;
import static org.springframework.test.web.servlet.request.MockMvcRequestBuilders.get;
import static org.springframework.test.web.servlet.result.MockMvcResultMatchers.status;

import java.util.List;

import com.example.demo.common.SqlCountingFilter;

import org.junit.jupiter.api.Test;
import org.springframework.beans.factory.annotation.Autowired;
import org.springframework.boot.test.context.SpringBootTest;
import org.springframework.boot.webmvc.test.autoconfigure.AutoConfigureMockMvc;
import org.springframework.test.web.servlet.MockMvc;
import org.springframework.test.web.servlet.MvcResult;

@SpringBootTest
@AutoConfigureMockMvc
class OrderQueryCountTest {

    @Autowired
    MockMvc mockMvc;

    @Test
    void orderPageRunsAtMostThreeStatements() throws Exception {
        MvcResult result = mockMvc.perform(get("/api/orders").param("page", "3").param("size", "20"))
                .andExpect(status().isOk())
                .andReturn();

        @SuppressWarnings("unchecked")
        List<String> statements = (List<String>) result.getRequest().getAttribute(SqlCountingFilter.STATEMENTS);
        assertThat(statements)
                .as("SQL statements for GET /api/orders?page=3&size=20")
                .hasSizeLessThanOrEqualTo(3);
    }
}
The test runs against the PostgreSQL container, like the application. By default Gradle prints only java.lang.AssertionError at OrderQueryCountTest.java:35 for a failure, so the build prints the whole message:
tasks.named('test') {
	useJUnitPlatform()
	testLogging {
		events 'failed'
		exceptionFormat = 'full'
	}
}./gradlew test --tests 'com.example.demo.order.OrderQueryCountTest'Against the service above, trimmed in the middle:
OrderQueryCountTest > orderPageRunsAtMostThreeStatements() FAILED
    java.lang.AssertionError: [SQL statements for GET /api/orders?page=3&size=20]
    Expecting size of:
      ["select o1_0.id,o1_0.customer_id,o1_0.placed_at from orders o1_0 order by o1_0.id offset ? rows fetch first ? rows only",
        "select count(o1_0.id) from orders o1_0",
        "select l1_0.order_id,l1_0.id,l1_0.product_id,l1_0.quantity,l1_0.unit_price from order_lines l1_0 where l1_0.order_id=?",
        "select p1_0.id,p1_0.category_id,p1_0.name,p1_0.price,p1_0.sku from products p1_0 where p1_0.id=?",
        ...
        "select p1_0.id,p1_0.category_id,p1_0.name,p1_0.price,p1_0.sku from products p1_0 where p1_0.id=?"]
    to be less than or equal to 3 but was 83
        at com.example.demo.order.OrderQueryCountTest.orderPageRunsAtMostThreeStatements(OrderQueryCountTest.java:35)

1 test completed, 1 failed
The failure lists the SQL, so it says which association to fix. With the two-query version of the service from later in this article, the same command ended in BUILD SUCCESSFUL and the filter logged 3 statements. A limit like ≤ 3 is a budget per endpoint: a new lazy association in the response breaks the build instead of production.
Beyond JOIN FETCH: batch fetching, subselect and the two-query pattern
The rest of the fetching measurements come from a CommandLineRunner behind a lab-fetch profile. For each variant it maps page 3 of 20 orders to OrderResponse inside a read-only TransactionTemplate, 20 times to warm up and 15 times timed, then once more between a pg_stat_statements_reset() and a read of pg_stat_statements. The times are the best of 15 with the database on the same machine, next to the 1-minute load average the JVM reported; they are indicative, while the statement and row counts are exact. Each output starts with the code path: lazy is the unchanged orders.findAll(pageable), run with whatever mapping the section describes.
What JOIN FETCH with a Pageable sends in Hibernate 7.4
Article 29 of the Basics course paged a fetch join and found that Hibernate 7.4 did not apply the page in memory. The same on the order page, with both levels fetched and a separate count query:
@Query(value = "select o from Order o left join fetch o.lines l left join fetch l.product",
        countQuery = "select count(o) from Order o")
Page<Order> findPageWithLines(Pageable pageable);=== join-fetch | load 2.98 | statements 2 (pg calls 2) | rows 82 | best 1.11 ms of 15 | orders 20 lines 81 totalElements 200
calls 1 rows 1 select count(o1_0.id) from orders o1_0
calls 1 rows 81 select o1_0.id,o1_0.customer_id,l1_0.order_id,l1_0.id,l1_0.product_id,p1_0.id,p1_0.category_id,p1_0.name,p1_0.price,p1_0.sku,l1_0.quantity,l1_0.unit_price,o1_0.placed_at from (select o1_0.id,o1_0.customer_id,o1_0.placed_at from orders o1_0 order by o1_0.id offset $1 rows fetch first $2 rows only) o1_0(id,customer_id,placed_at) left join order_lines l1_0 on o1_0.id=l1_0.order_id left join products p1_0 on p1_0.id=l1_0.product_id order by o1_0.idTwo statements, and the page is applied to the orders in a derived table before the lines are joined. @EntityGraph(attributePaths = {"lines", "lines.product"}) on a derived Page<Order> findGraphBy(Pageable pageable) sent the same row query and select count(*) from orders o1_0, in 1.55 ms. Each of the 81 rows repeats the order's columns next to the line's and the product's, which is the cost of a join; the next fix transfers every row once.
@BatchSize on a collection
@BatchSize tells Hibernate that when it initializes one lazy lines collection, it should initialize up to that many others waiting in the same persistence context with the same query:
    @OneToMany(mappedBy = "order", cascade = CascadeType.ALL, orphanRemoval = true)
    @BatchSize(size = 20)
private List<OrderLine> lines = new ArrayList<>();org.hibernate.annotations.BatchSize, with the service unchanged:
=== lazy | load 2.32 | statements 64 (pg calls 64) | rows 163 | best 8.52 ms of 15 | orders 20 lines 81 totalElements 200
   calls   1 rows    1  select count(o1_0.id) from orders o1_0
   calls   1 rows   81  select l1_0.order_id,l1_0.id,l1_0.product_id,l1_0.quantity,l1_0.unit_price from order_lines l1_0 where l1_0.order_id = any ($1)
   calls   1 rows   20  select o1_0.id,o1_0.customer_id,o1_0.placed_at from orders o1_0 order by o1_0.id offset $1 rows fetch first $2 rows only
   calls  61 rows   61  select p1_0.id,p1_0.category_id,p1_0.name,p1_0.price,p1_0.sku from products p1_0 where p1_0.id=$1
The 20 line queries became one, and the 61 product queries stayed: the annotation on a collection batches that collection and nothing else. From 83 statements to 64.
The SQL is not the in (?,?,?,…) list that most articles show. On PostgreSQL, Hibernate 7 sends one array parameter, and the bind log (logging.level.org.hibernate.orm.jdbc.bind=trace) shows its content:
select l1_0.order_id,l1_0.id,l1_0.product_id,l1_0.quantity,l1_0.unit_price from order_lines l1_0 where l1_0.order_id = any (?)
binding parameter (1:ARRAY) <- [[61, 62, 63, 64, 65, 66, 67, 68, 69, 70, 71, 72, 73, 74, 75, 76, 77, 78, 79, 80]]
hibernate.default_batch_fetch_size for every lazy association
The global setting applies the same batching to every lazy collection and every lazy to-one proxy, without an annotation:
spring.jpa.properties.hibernate.default_batch_fetch_size=50 With @BatchSize removed again:
=== lazy | load 2.83 | statements 5 (pg calls 5) | rows 163 | best 4.12 ms of 15 | orders 20 lines 81 totalElements 200
   calls   1 rows    1  select count(o1_0.id) from orders o1_0
   calls   1 rows   81  select l1_0.order_id,l1_0.id,l1_0.product_id,l1_0.quantity,l1_0.unit_price from order_lines l1_0 where l1_0.order_id = any ($1)
   calls   1 rows   20  select o1_0.id,o1_0.customer_id,o1_0.placed_at from orders o1_0 order by o1_0.id offset $1 rows fetch first $2 rows only
   calls   2 rows   61  select p1_0.id,p1_0.category_id,p1_0.name,p1_0.price,p1_0.sku from products p1_0 where p1_0.id = any ($1)
Five statements for the same 163 rows that the N+1 read in 83. The 61 products took two statements, and the bind log shows the second one:
select p1_0.id,p1_0.category_id,p1_0.name,p1_0.price,p1_0.sku from products p1_0 where p1_0.id = any (?)
binding parameter (1:ARRAY) <- [[59, 90, 21, 52, 66, 97, 28, 73, 4, 35, 80, 11, 42, 87, 18, 49, 94, 25, 56, 1, 32, 63, 8, 39, 70, 15, 46, 77, 22, 53, 84, 29, 60, 91, 36, 67, 98, 43, 74, 5, 50, 81, 12, 57, 88, 19, 64, 95, 26, 71]]
select p1_0.id,p1_0.category_id,p1_0.name,p1_0.price,p1_0.sku from products p1_0 where p1_0.id = any (?)
binding parameter (1:ARRAY) <- [[2, 33, 78, 9, 40, 85, 16, 47, 92, 23, 54]]
50 ids, then the remaining 11, in an array of 11 elements. There is no padding with nulls or repeated ids, and every batch uses the same SQL text whatever its size. The array form depends on the dialect. In Hibernate's source, the batch loader uses it when Dialect.useArrayForMultiValuedParameters() returns true, as it does for PostgreSQL. H2Dialect overrides it to return false, with the comment "Performance is worse than the in-predicate version", so the same mapping sends an in (…) list there. This article did not run that case.
default_batch_fetch_size=20 sent 7 statements for the same page: the lines in one, then products in three batches of 20 and one where p1_0.id=? for the last id, 4.17 ms. The annotation on a class is the per-entity form of the same thing. With @BatchSize(size = 20) on Order.lines and @BatchSize(size = 50) on the Product class, instead of the property, the page took 5 statements and 3.44 ms.
Batch fetching beats JOIN FETCH when:
- The query should not change. The repository method stays
findAll(pageable); every mapping that reaches a lazy association benefits, including ones added later. - There are several collections. Each batch is its own query, so there is no cartesian product and no
MultipleBagFetchException. - Rows are wide. Each order, line and product row crosses the network once instead of the order being repeated on every line.
It costs round trips: 5 statements where the fetch join needs 2, one per level and per 50 entities.
@Fetch(FetchMode.SUBSELECT) and paging
SUBSELECT loads the collection for every owner the original query returned, by repeating that query as a subquery:
    @OneToMany(mappedBy = "order", cascade = CascadeType.ALL, orphanRemoval = true)
    @Fetch(FetchMode.SUBSELECT)
    private List<OrderLine> lines = new ArrayList<>();
With @BatchSize(size = 50) still on Product:
=== lazy | load 2.65 | statements 5 (pg calls 5) | rows 922 | best 5.76 ms of 15 | orders 20 lines 81 totalElements 200
   calls   1 rows    1  select count(o1_0.id) from orders o1_0
   calls   1 rows  801  select l1_0.order_id,l1_0.id,l1_0.product_id,l1_0.quantity,l1_0.unit_price from order_lines l1_0 where l1_0.order_id in (select o1_0.id from orders o1_0)
   calls   1 rows   20  select o1_0.id,o1_0.customer_id,o1_0.placed_at from orders o1_0 order by o1_0.id offset $1 rows fetch first $2 rows only
   calls   2 rows  100  select p1_0.id,p1_0.category_id,p1_0.name,p1_0.price,p1_0.sku from products p1_0 where p1_0.id = any ($1)
The subquery is select o1_0.id from orders o1_0, without the offset and fetch first of the page query. Hibernate loaded the lines of all 200 orders, 801 rows for a page that shows 81, and because those lines put a proxy for every product in the persistence context, the product batches loaded all 100 products too. 922 rows against 163. On a paged query, SUBSELECT reads the whole table; it only fits a query that loads every owner it will use.
The two-query pattern for paging parents with children
Article 29 of the Basics course checked the common warning that a paged fetch join is applied in memory, and Hibernate 7.4.5 did not log it. The derived-table rewrite that replaced it is recent: the class that performs it, CollectionFetchPaginationQueryTransformer, is in the sources of Hibernate ORM 7.4.0 and absent from 7.3.13. Hibernate 7.4 also falls back to in-memory paging when the rewrite is unsafe. Sorting by a line column before the order is one such case:
@Query(value = "select o from Order o left join fetch o.lines l order by l.unitPrice desc, o.id",
        countQuery = "select count(o) from Order o")
Page<Order> findPageOrderedByLinePrice(Pageable pageable);WARN org.hibernate.orm.query : HHH90003004: firstResult/maxResults specified with collection fetch; applying in memory
select o1_0.id,o1_0.customer_id,l1_0.order_id,l1_0.id,l1_0.product_id,l1_0.quantity,l1_0.unit_price,o1_0.placed_at from orders o1_0 left join order_lines l1_0 on o1_0.id=l1_0.order_id order by l1_0.unit_price desc,o1_0.idNo offset, no fetch first: PostgreSQL returned 801 rows so that Hibernate could keep five orders. With spring.jpa.properties.hibernate.query.fail_on_pagination_over_collection_fetch=true, the same call failed instead of warning:
org.springframework.orm.jpa.JpaSystemException: setFirstResult() or setMaxResults() specified with collection fetch join (in-memory pagination was about to be applied, but 'hibernate.query.fail_on_pagination_over_collection_fetch' is enabled)Filtering by the lines is the other case, and it breaks either way. Orders that contain a keyboard, as a paged fetch join, ended in PostgreSQL's ERROR: missing FROM-clause entry for table "c2_0", the same failure Basics 29 found with tags. Without a Pageable, the query ran and returned wrong data:
@Query("select o from Order o left join fetch o.lines l left join fetch l.product p where p.category.name = :category order by o.id")
List<Order> findWithKeyboardLines(String category); order 1 lines 1
order 7 lines 1
order 8 lines 1
order 9 lines 1
order 10 lines 1
db: order 1 lines 4
db: order 7 lines 4
db: order 8 lines 5
db: order 9 lines 3
db: order 10 lines 4The where filtered the fetched collection itself, so each order came back holding only its keyboard line, as managed entities that look complete.
The two-query pattern avoids all three cases and does not depend on the 7.4 rewrite. The first query pages the ids, with the filter and sort the page needs; the second loads those orders with their children, unpaged:
@Query(value = "select o.id from Order o", countQuery = "select count(o) from Order o")
Page<Long> findIds(Pageable pageable);

@Query("select o from Order o left join fetch o.lines l left join fetch l.product where o.id in :ids")
List<Order> findWithLinesByIdIn(Collection<Long> ids);@Transactional(readOnly = true)
public PageResponse<OrderResponse> findPage(Pageable pageable) {
return PageResponse.from(orders.findAll(pageable).map(OrderResponse::from));
Page<Long> ids = orders.findIds(pageable);
Map<Long, Order> byId = orders.findWithLinesByIdIn(ids.getContent()).stream()
.collect(Collectors.toMap(Order::getId, Function.identity()));
return PageResponse.from(ids.map(id -> OrderResponse.from(byId.get(id))));
}ids.map keeps the page's order and metadata, so the second query needs no order by:
=== two-query | load 2.98 | statements 3 (pg calls 3) | rows 102 | best 1.53 ms of 15 | orders 20 lines 81 totalElements 200
   calls   1 rows    1  select count(o1_0.id) from orders o1_0
   calls   1 rows   20  select o1_0.id from orders o1_0 order by o1_0.id offset $1 rows fetch first $2 rows only
   calls   1 rows   81  select o1_0.id,o1_0.customer_id,l1_0.order_id,l1_0.id,l1_0.product_id,p1_0.id,p1_0.category_id,p1_0.name,p1_0.price,p1_0.sku,l1_0.quantity,l1_0.unit_price,o1_0.placed_at from orders o1_0 left join order_lines l1_0 on o1_0.id=l1_0.order_id left join products p1_0 on p1_0.id=l1_0.product_id where o1_0.id in ($1,$2,$3,$4,$5,$6,$7,$8,$9,$10,$11,$12,$13,$14,$15,$16,$17,$18,$19,$20)
The filter goes into the id query, where it cannot touch the collections:
@Query(value = "select o.id from Order o where exists (select 1 from OrderLine l where l.order = o and l.product.category.name = :category)",
        countQuery = "select count(o) from Order o where exists (select 1 from OrderLine l where l.order = o and l.product.category.name = :category)")
Page<Long> findIdsContainingCategory(String category, Pageable pageable);
Page 0 of 5, then findWithLinesByIdIn, in 3 statements:
    order 1 lines 4
    order 7 lines 4
    order 8 lines 5
    order 9 lines 3
    order 10 lines 4
    totalElements 99 totalPages 20
Complete orders, and a count of orders rather than of joined rows. With this service, OrderQueryCountTest passed.
Fetching strategies compared
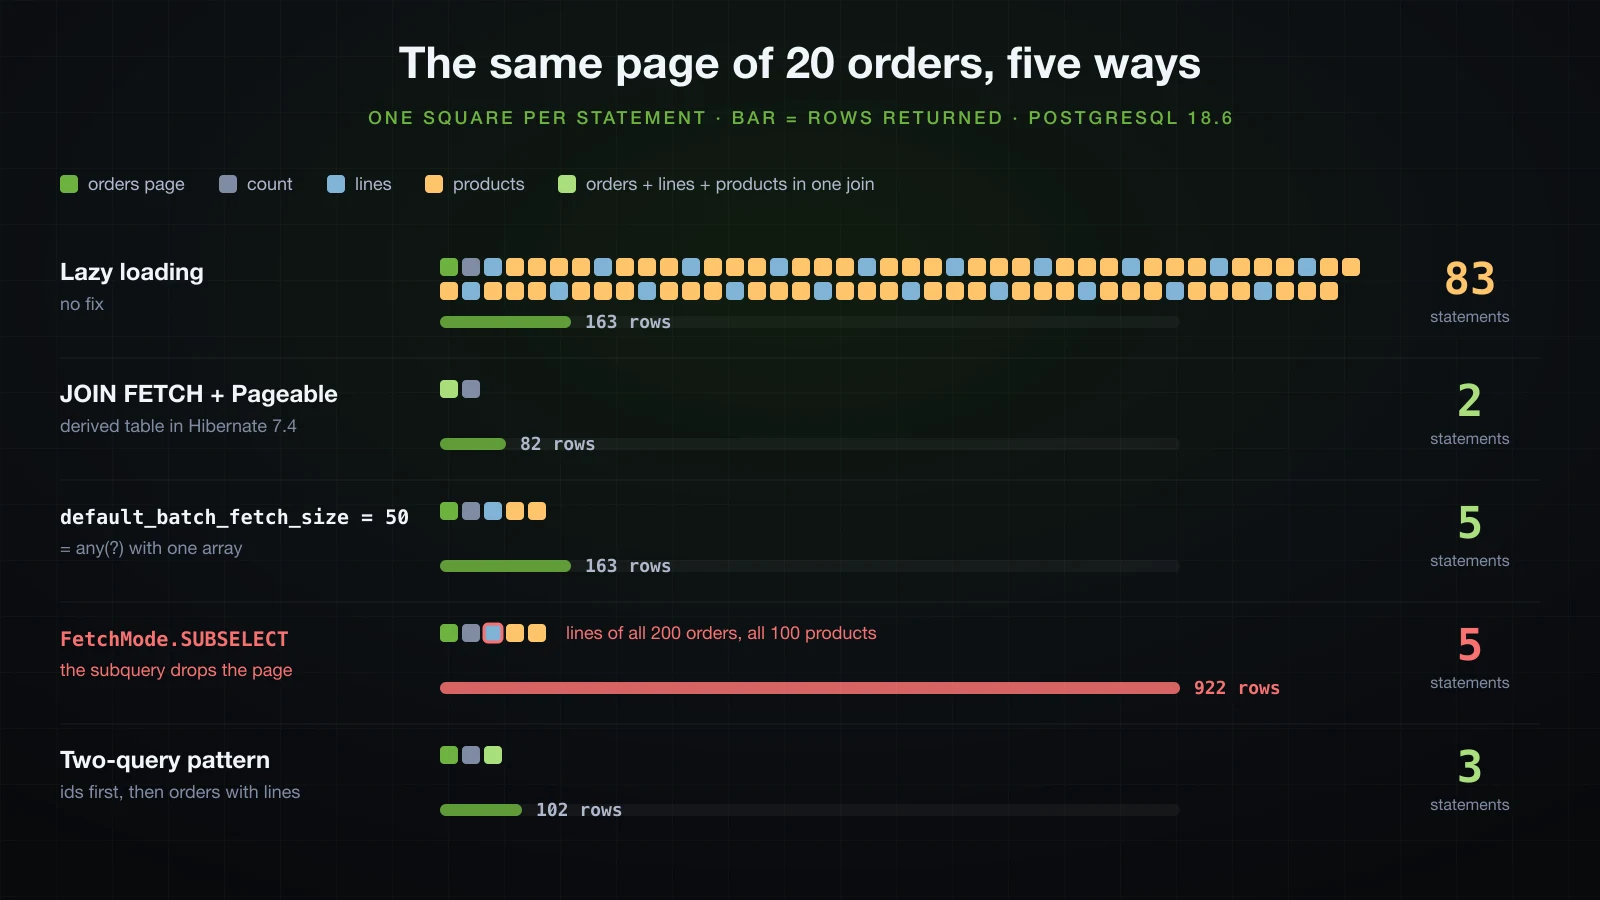
Page 3 of 20 orders mapped to OrderResponse, PostgreSQL 18.6, best of 15 runs:
| Technique | Statements | Rows transferred | Paging-safe | Best time | Load |
|---|---|---|---|---|---|
| Lazy loading, no fix | 83 | 163 | Yes, pages in SQL | 11.29 ms | 2.98 |
JOIN FETCH + countQuery | 2 | 82 | Yes on 7.4 via a derived table; in memory when sorted by a line column; fails when filtered by one | 1.11 ms | 2.98 |
@EntityGraph on a derived query | 2 | 82 | Same as JOIN FETCH | 1.55 ms | 2.98 |
@BatchSize(20) on Order.lines only | 64 | 163 | Yes | 8.52 ms | 2.32 |
default_batch_fetch_size=20 | 7 | 163 | Yes | 4.17 ms | 2.82 |
default_batch_fetch_size=50 | 5 | 163 | Yes | 4.12 ms | 2.83 |
@BatchSize on lines and on Product | 5 | 163 | Yes | 3.44 ms | 2.19 |
@Fetch(SUBSELECT) on lines | 5 | 922 | No: the subquery drops the page | 5.76 ms | 2.65 |
| Two-query pattern | 3 | 102 | Yes; filters and sorts go into the id query | 1.53 ms | 2.98 |
A workable policy for an application:
- Set
default_batch_fetch_sizeglobally, 50 here. It caps the damage of any lazy association nobody planned for at one statement per 50 entities. - Give each list endpoint an explicit fetch plan: the two-query pattern for pages of parents with children, or a fetch join when the query neither sorts nor filters by the children.
- Put a statement budget in a test for every endpoint that returns a list.
- Never combine
SUBSELECTwith paging.
Projections: selecting only what the response needs
Every fix above still builds entities, and entities cost more than their rows. Each one is registered in the persistence context and, in a read-write transaction, checked for changes at flush. An endpoint that shows a product list needs neither. Spring Data JPA builds projections from the return type of a repository method, and the kind of projection decides what SQL Hibernate sends and what stays in the persistence context.
A lab-projections profile called each method below for the 13 products in Keyboards, inside a read-write TransactionTemplate, printed the result and the number of managed entities from Hibernate's persistence context, and logged the session metrics at commit:
entityManager.unwrap(SessionImplementor.class).getPersistenceContextInternal().getNumberOfManagedEntities()The baseline, List<Product> findByCategoryNameOrderByPrice(String category):
select p1_0.id,p1_0.category_id,p1_0.name,p1_0.price,p1_0.sku from products p1_0 join categories c1_0 on c1_0.id=p1_0.category_id where c1_0.name=? order by p1_0.price
    13 results, first: Product[65, Keyboard 09, 14.90]
    managed entities in the persistence context: 13
	2453625 ns executing 1 flushes (flushing a total of 13 entities and 0 collections)
Every column, 13 managed entities, and 13 entities dirty-checked at commit although nothing changed.
Closed interface projections
An interface whose getters all match entity properties is a closed projection:
package com.example.demo.product;

import java.math.BigDecimal;

public interface ProductSummary {

    Long getId();

    String getName();

    BigDecimal getPrice();
}List<ProductSummary> findSummariesByCategoryNameOrderByPrice(String category);select p1_0.id,p1_0.name,p1_0.price from products p1_0 join categories c1_0 on c1_0.id=p1_0.category_id where c1_0.name=? order by p1_0.price
13 results, first: ProductSummary[65, Keyboard 09, 14.90]
result class: jdk.proxy2.$Proxy131
managed entities in the persistence context: 0
10875 ns executing 1 flushes (flushing a total of 0 entities and 0 collections)Three columns, no entities, nothing to dirty-check. The result objects are JDK proxies.
Open projections with SpEL load the whole entity
A getter with @Value computes its value from target, the entity:
package com.example.demo.product;

import org.springframework.beans.factory.annotation.Value;

public interface ProductLabel {

    @Value("#{target.name + ' (' + target.sku + ')'}")
    String getLabel();
}
Returned from List<ProductLabel> findLabelsByCategoryNameOrderByPrice(String category):
select p1_0.id,p1_0.category_id,p1_0.name,p1_0.price,p1_0.sku from products p1_0 join categories c1_0 on c1_0.id=p1_0.category_id where c1_0.name=? order by p1_0.price
    13 results, first: ProductLabel[Keyboard 09 (SKU-0065)]
    result class: jdk.proxy2.$Proxy132
    managed entities in the persistence context: 13
	200833 ns executing 1 flushes (flushing a total of 13 entities and 0 collections)
Spring Data cannot know which properties an expression reads, so it loads the entity: all five columns, 13 managed entities and 13 dirty-checked at commit, the same cost as returning Product. An open projection is a view over an entity, not a way to read less. A default method computes the same label and keeps the interface closed, here returned from List<ProductLabelView> findLabelViewsByCategoryNameOrderByPrice(String category):
package com.example.demo.product;

public interface ProductLabelView {

    String getName();

    String getSku();

    default String getLabel() {
        return getName() + " (" + getSku() + ")";
    }
}select p1_0.name,p1_0.sku from products p1_0 join categories c1_0 on c1_0.id=p1_0.category_id where c1_0.name=? order by p1_0.price
13 results, first: ProductLabelView[Keyboard 09 (SKU-0065)]
managed entities in the persistence context: 0Two columns, the ones the abstract getters name, and no entities.
Record DTOs: derived queries and select new
A record works as a return type of a derived query. Spring Data reads its constructor parameters:
package com.example.demo.product;

import java.math.BigDecimal;

public record ProductRow(Long id, String name, BigDecimal price) {
}List<ProductRow> findRowsByCategoryNameOrderByPrice(String category);
@Query("select new com.example.demo.product.ProductRow(p.id, p.name, p.price) from Product p where p.category.name = :category order by p.price")
List<ProductRow> findRowsJpql(String category);
@Query("select p.id, p.name, p.price from Product p where p.category.name = :category order by p.price")
List<ProductRow> findRowsJpqlWithoutNew(String category);All three sent the same statement:
select p1_0.id,p1_0.name,p1_0.price from products p1_0 join categories c1_0 on c1_0.id=p1_0.category_id where c1_0.name=? order by p1_0.price
    13 results, first: ProductRow[id=65, name=Keyboard 09, price=14.90]
    result class: com.example.demo.product.ProductRow
    managed entities in the persistence context: 0
The third method has no new: Spring Data JPA rewrote the property list into a constructor expression for the record. The class that does it, DtoProjectionTransformerDelegate, carries @since 3.5, which dates the feature. select new with the fully qualified class name is standard JPQL and does not depend on the rewrite.
Dynamic projections
One method can return any of these shapes when the caller passes the type:
<T> List<T> findByCategoryName(String category, Class<T> type);| Call | SQL columns | Result | Managed entities |
|---|---|---|---|
findByCategoryName("Keyboards", ProductRow.class) | p1_0.id,p1_0.name,p1_0.price | ProductRow | 0 |
findByCategoryName("Keyboards", ProductSummary.class) | p1_0.id,p1_0.name,p1_0.price | JDK proxy | 0 |
findByCategoryName("Keyboards", Product.class) | all five | Product | 13 |
The type decides the SQL at call time, so a service can offer a cheap list and a full entity from the same repository method.
Native queries mapped to an interface
A native query can return an interface whose getters match the column aliases. A report per category:
package com.example.demo.product;

import java.math.BigDecimal;

public interface CategoryStats {

    String getCategory();

    long getProducts();

    BigDecimal getAveragePrice();
}@NativeQuery("""
select c.name as category, count(*) as products, round(avg(p.price), 2) as averagePrice
from products p join categories c on c.id = p.category_id
group by c.name
order by c.name""")
List<CategoryStats> categoryStats(); 8 results, first: CategoryStats[Cables, 12, 226.57]
result class: jdk.proxy2.$Proxy135
managed entities in the persistence context: 0
3249 ns executing 2 flushes (flushing a total of 0 entities and 0 collections)Named getters instead of the Object[] rows that article 27 of the Basics course read by position, and no entities. The session ran two flushes, one more than the JPQL methods: Hibernate cannot tell which tables a native query reads, so it flushes the persistence context before running one.
Projections and the persistence context
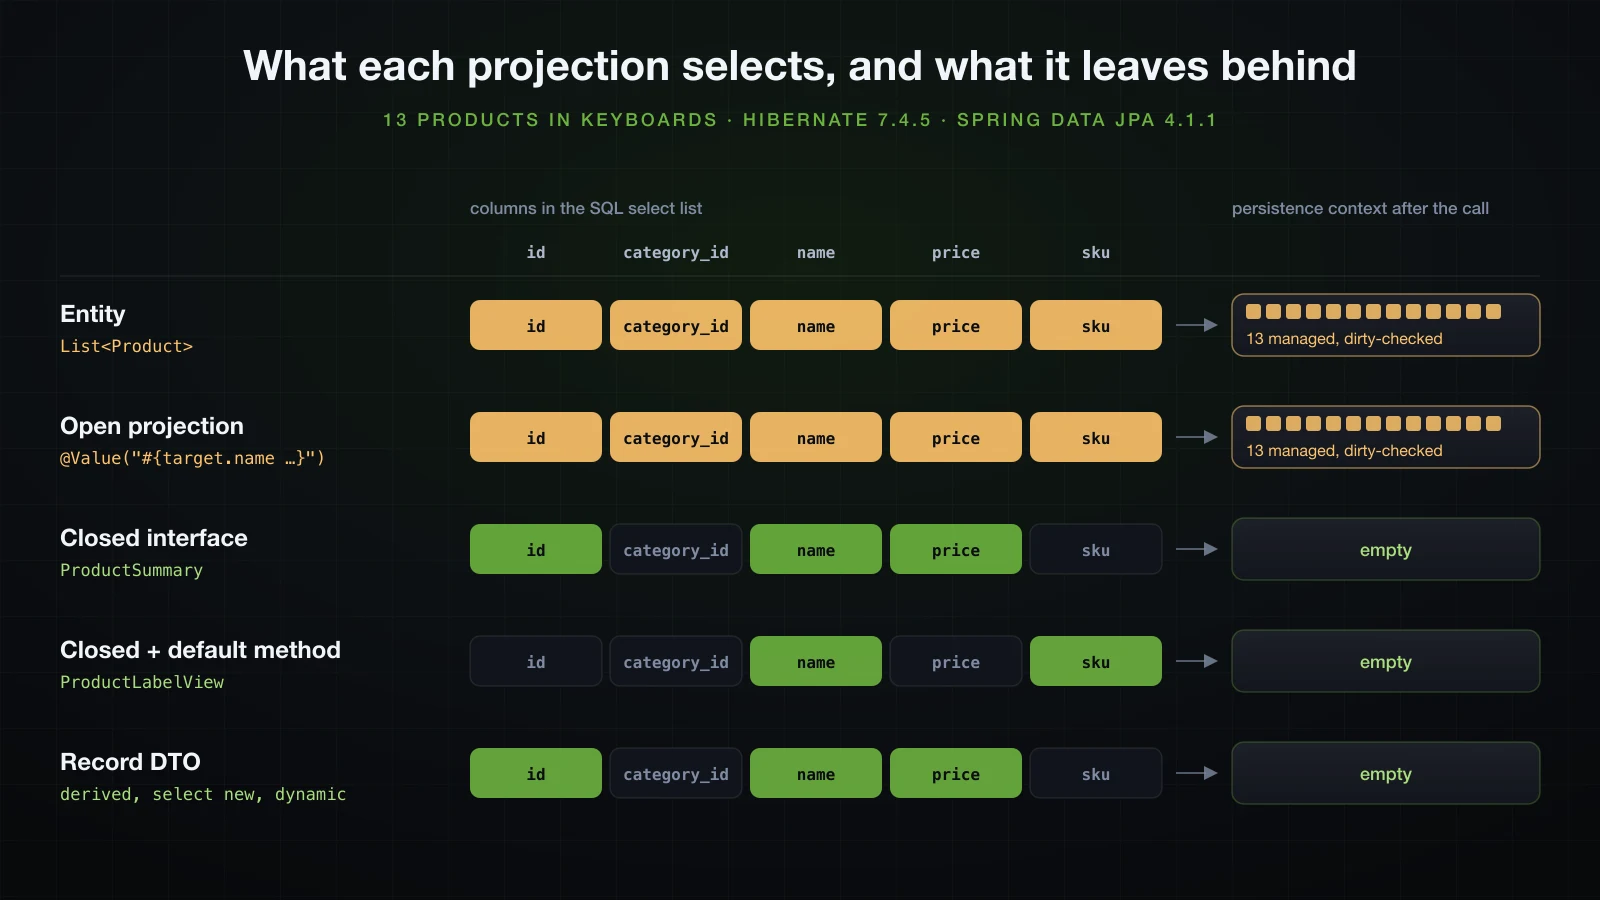
| Return type | Columns selected | Managed after the call | Entities dirty-checked at commit |
|---|---|---|---|
Product entity | 5 of 5 | 13 | 13 |
Closed interface ProductSummary | 3 | 0 | 0 |
| Closed interface with a default method | 2 | 0 | 0 |
Open interface with @Value | 5 of 5 | 13 | 13 |
| Record, derived query | 3 | 0 | 0 |
Record, select new | 3 | 0 | 0 |
| Native query to an interface | the query's aliases | 0 | 0 |
One more shape behaves between the two groups. A closed interface with a nested interface, ProductWithCategory with CategoryName getCategory(), selected p1_0.name,c1_0.id,c1_0.name and left 1 managed entity: the nested projection was built from a real Category entity, which was then dirty-checked at commit. Only flat closed interfaces and DTOs stay outside the persistence context.
A projection is a copy of values, not a managed object. Nothing tracks it, so nothing is written back when it changes, which is exactly what a read endpoint wants and exactly wrong for code that means to update.
A read-model endpoint with a record projection
The order list does not need entities either. A summary per order is one JPQL query with a constructor expression:
package com.example.demo.order;

import java.math.BigDecimal;
import java.time.Instant;

public record OrderSummary(Long id, Instant placedAt, String customerEmail, long lines, BigDecimal total) {
}@Query(value = """
select new com.example.demo.order.OrderSummary(o.id, o.placedAt, c.email, count(l), sum(l.unitPrice * l.quantity))
from Order o join o.customer c join o.lines l
group by o.id, o.placedAt, c.email""",
countQuery = "select count(o) from Order o")
Page<OrderSummary> findSummaries(Pageable pageable);@GetMapping("/summaries")
public PageResponse<OrderSummary> findSummaries(@PageableDefault(size = 20, sort = "id") Pageable pageable) {
return service.findSummaries(pageable);
}service.findSummaries is a read-only transaction that returns PageResponse.from(orders.findSummaries(pageable)). The inner join o.lines drops orders without lines, which this data set has none of; a left join keeps them.
select o1_0.id,o1_0.placed_at,c1_0.email,count(l1_0.id),sum((l1_0.unit_price*l1_0.quantity)) from orders o1_0 join customers c1_0 on c1_0.id=o1_0.customer_id join order_lines l1_0 on o1_0.id=l1_0.order_id group by o1_0.id,o1_0.placed_at,c1_0.email order by o1_0.id offset ? rows fetch first ? rows only
select count(o1_0.id) from orders o1_0
INFO c.example.demo.common.SqlCountingFilter : GET /api/orders/summaries?page=3&size=20 -> 2 SQL statements{"content":[{"id":61,"placedAt":"2026-01-19T03:00:00Z","customerEmail":"customer11@example.com","lines":4,"total":2193.00},{"id":62,"placedAt":"2026-01-19T10:00:00Z","customerEmail":"customer12@example.com","lines":5,"total":2236.60},GET …?page=3&size=20 | Statements | Rows | Response bytes | Best of 20 over HTTP |
|---|---|---|---|---|
/api/orders, two-query entities | 3 | 102 | 5,979 | 3.95 ms |
/api/orders/summaries, record projection | 2 | 21 | 2,301 | 2.98 ms |
Measured with curl after 30 warm-up requests, load average 2.75. The database did the sum and the count; the application received 20 rows. For a read-heavy list, a record projection is the default worth starting from; entities are for the screen that edits an order.
Batch inserts on PostgreSQL
The import and how it was measured
The import is 2,000 orders with 4 lines each, 10,000 rows in two tables, saved through the cascade from article 28:
tx.execute(status -> {
    List<Order> batch = new ArrayList<>(2000);
    for (int i = 0; i < 2000; i++) {
        Order order = new Order(entityManager.getReference(Customer.class, 1L + i % 50),
                Instant.parse("2026-09-01T00:00:00Z").plus(i, ChronoUnit.MINUTES));
        for (int n = 1; n <= 4; n++) {
            long productId = 1 + (i * 7L + n * 31L) % 100;
            order.addLine(new OrderLine(entityManager.getReference(Product.class, productId),
                    1 + (i + n) % 4, prices.get(productId)));
        }
        batch.add(order);
    }
    return orderRepository.saveAll(batch);
});
getReference gives a proxy for each customer and product without a SELECT, and prices was read once before the timing. A lab-import runner deleted the previous run's rows, ran vacuum analyze, reset pg_stat_statements, and timed the transaction including its commit: one warm-up run, then five timed. The 1-minute load average stayed between 2.7 and 6.1 during these runs; each row of the table below gives its own.
IDENTITY: one INSERT per row
With the identity keys of V1, Hibernate logged one INSERT per entity, and PostgreSQL received this:
   calls   8000 rows   8000  insert into order_lines (order_id,product_id,quantity,unit_price) values ($1,$2,$3,$4) RETURNING *
   calls   2000 rows   2000  insert into orders (customer_id,placed_at) values ($1,$2) RETURNING *
The RETURNING * is not in Hibernate's SQL log. Hibernate asks the driver for generated keys, and the PostgreSQL driver appends it. The key only exists once the row does, so Hibernate executes the INSERT during persist, at the moment it needs the id, and cannot hold rows back to send them together. Setting hibernate.jdbc.batch_size=50 and hibernate.order_inserts=true changed nothing in the session metrics:
	1537914 ns preparing 10000 JDBC statements
	1331657082 ns executing 10000 JDBC statements
	0 ns executing 0 JDBC batches
10,000 statements, 0 batches. Best of 5: 1,372.2 ms without the settings and 1,418.7 ms with them.
SEQUENCE with a pooled optimizer
A sequence hands out keys before the INSERT, so Hibernate can queue the rows until flush. With allocationSize = 50, one nextval covers 50 ids when the sequence increments by 50. The migration replaces the identity columns of the two tables that receive imports:
alter table orders alter column id drop identity;
alter table order_lines alter column id drop identity;

create sequence orders_seq increment by 50;
create sequence order_lines_seq increment by 50;

select setval('orders_seq', (select max(id) from orders));
select setval('order_lines_seq', (select max(id) from order_lines));
Dropping the identity matters: with both left in place, a raw insert that relied on the identity default could collide with ids Hibernate took from the sequence. Without a default, every insert has to supply its id.
    @Id
    @GeneratedValue(strategy = GenerationType.IDENTITY)
    @GeneratedValue(strategy = GenerationType.SEQUENCE, generator = "orders_seq")
    @SequenceGenerator(name = "orders_seq", sequenceName = "orders_seq", allocationSize = 50)
    private Long id;
OrderLine gets the same change with order_lines_seq, and ddl-auto=validate accepted both sequences. Without batch settings:
   calls   8000 rows   8000  insert into order_lines (order_id,product_id,quantity,unit_price,id) values ($1,$2,$3,$4,$5)
   calls   2000 rows   2000  insert into orders (customer_id,placed_at,id) values ($1,$2,$3)
   calls    200 rows    200  select nextval('orders_seq')
The id is now a bound parameter and there is no RETURNING. The 200 nextval calls are 40 for orders_seq and 160 for order_lines_seq: the SQL log counted 40 and 160, and the two sequences advanced by 2,000 and 8,000. pg_stat_statements folded both into the single entry shown. Still 10,000 INSERTs one by one: 1,196.5 ms.
hibernate.jdbc.batch_size and hibernate.order_inserts
spring.jpa.properties.hibernate.jdbc.batch_size=50 535605 ns preparing 4200 JDBC statements
23395792 ns executing 200 JDBC statements
695271525 ns executing 4000 JDBC batches4,000 batches for 10,000 rows, 755.8 ms. The cascade queues the rows in the order they were persisted, an order then its four lines, and Hibernate closes the current batch whenever the next statement targets another table: batches of 1 order, then 4 lines, 2,000 times each. Sorting the queue by table fixes that:
spring.jpa.properties.hibernate.jdbc.batch_size=50
spring.jpa.properties.hibernate.order_inserts=true 72250 ns preparing 202 JDBC statements
21294954 ns executing 200 JDBC statements
110352048 ns executing 200 JDBC batches200 full batches of 50, 40 for orders and 160 for lines, and 162.6 ms. pg_stat_statements still counted 10,000 single-row INSERTs: batching changed how the statements travelled from the driver, not what PostgreSQL executed.
reWriteBatchedInserts=true
The PostgreSQL driver can rewrite a batch into multi-row INSERT statements. It is a connection property:
spring.datasource.url=jdbc:postgresql://localhost:5505/demo
spring.datasource.url=jdbc:postgresql://localhost:5505/demo?reWriteBatchedInserts=true
Hibernate's side did not change, 200 batches, but PostgreSQL received other statements. The long ones are shortened here:
   calls    200 rows    200  select nextval('orders_seq')
   calls    160 rows   2560  insert into order_lines (order_id,product_id,quantity,unit_price,id) values ($1,$2,$3,$4,$5),($6,$7,$8,$9,$10), ... ,($76,$77,$78,$79,$80)
   calls    160 rows   5120  insert into order_lines (order_id,product_id,quantity,unit_price,id) values ($1,$2,$3,$4,$5),($6,$7,$8,$9,$10), ... ,($156,$157,$158,$159,$160)
   calls    160 rows    320  insert into order_lines (order_id,product_id,quantity,unit_price,id) values ($1,$2,$3,$4,$5),($6,$7,$8,$9,$10)
   calls     40 rows    640  insert into orders (customer_id,placed_at,id) values ($1,$2,$3),($4,$5,$6), ... ,($46,$47,$48)
   calls     40 rows   1280  insert into orders (customer_id,placed_at,id) values ($1,$2,$3),($4,$5,$6), ... ,($94,$95,$96)
   calls     40 rows     80  insert into orders (customer_id,placed_at,id) values ($1,$2,$3),($4,$5,$6)
Each batch of 50 became three statements of 32, 16 and 2 rows, chunks whose sizes are powers of two: 600 INSERT statements instead of 10,000. Best of 5: 156.9 ms, against 162.6 ms without the rewrite. On this setup the rewrite changed the database's work, 600 executions against 10,000, far more than it changed the time.
The ten thousand rows, side by side
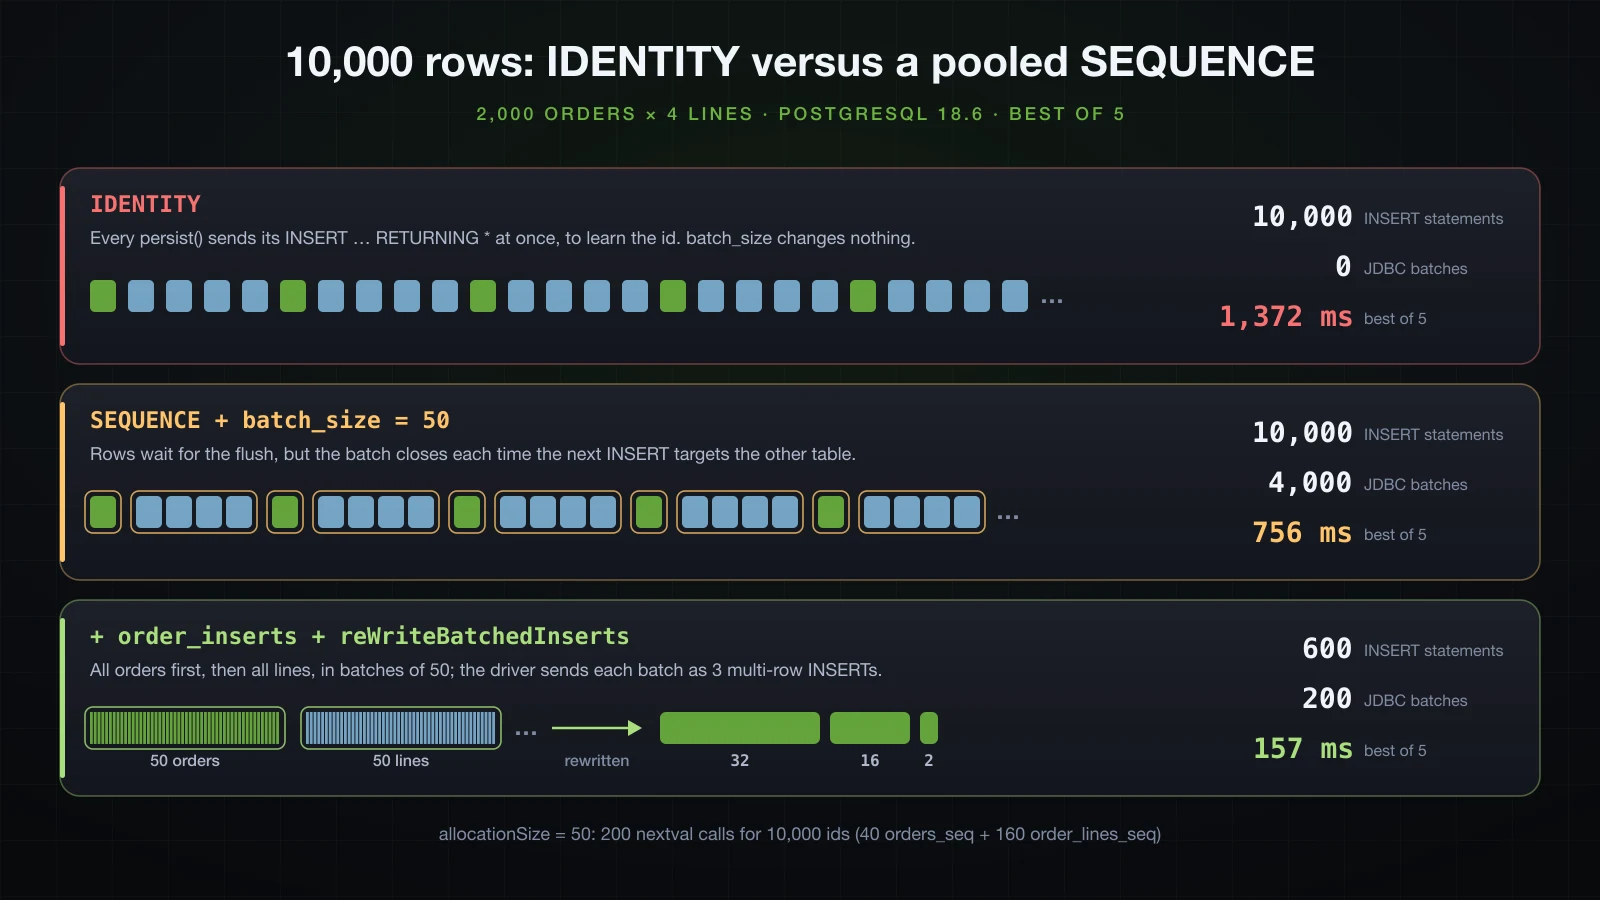
| Keys and settings | Statements PostgreSQL executed | JDBC batches | Best of 5 | Load |
|---|---|---|---|---|
IDENTITY | 10,000 INSERT | 0 | 1,372.2 ms | 5.06–5.29 |
IDENTITY, batch_size=50, order_inserts | 10,000 INSERT | 0 | 1,418.7 ms | 5.19–5.74 |
SEQUENCE, allocationSize=50 | 10,000 INSERT + 200 nextval | 0 | 1,196.5 ms | 4.29–4.42 |
+ batch_size=50 | 10,000 INSERT + 200 nextval | 4,000 | 755.8 ms | 5.82–6.07 |
+ order_inserts=true | 10,000 INSERT + 200 nextval | 200 | 162.6 ms | 5.82 |
+ reWriteBatchedInserts=true | 600 INSERT + 200 nextval | 200 | 156.9 ms | 5.52 |
The settings only work together. batch_size is ignored for identity keys, and without order_inserts the batches of a parent-child cascade stay tiny.
Flush and clear for very large imports
saveAll keeps every entity it saved in the persistence context until commit. For an import of unknown size, the loop flushes and clears every few batches instead:
// newOrder(i, prices) builds one order and its four lines, as in the loop above
for (int i = 0; i < orderCount; i++) {
    entityManager.persist(newOrder(i, prices));
    if ((i + 1) % 50 == 0) {
        entityManager.flush();
        entityManager.clear();
    }
}
flush sends the queued INSERTs, and clear detaches everything, so the persistence context never holds more than 50 orders and their lines. 20,000 orders, 100,000 rows, with all three batch settings, best of 3:
| 100,000 rows | Managed at commit | Heap used before commit, after System.gc() | Flushes | Best of 3 |
|---|---|---|---|---|
saveAll | 100,000 | 70.0 MB | 1 | 1,456.5 ms |
| flush and clear every 50 orders | 0 | 26.2 MB | 401 | 19,858.4 ms |
The memory went down as intended, and the time went up thirteenfold. The time went into PostgreSQL, not Hibernate. Every INSERT into order_lines runs the foreign key check SELECT 1 FROM ONLY "public"."orders" x WHERE "id" OPERATOR(pg_catalog.=) $1 FOR KEY SHARE OF x. Loading auto_explain into the session through Hikari's connection-init-sql, for a 300-order run of the loop, logged that check 1,200 times, every one as Seq Scan on orders x. The loop's first flush runs it while orders holds 250 rows, where a sequential scan is cheap. saveAll flushes once, and order_inserts puts all 20,000 orders ahead of their lines. The plan cache explains the difference: with set plan_cache_mode = force_custom_plan as the connection init SQL, which makes PostgreSQL plan each execution instead of reusing a cached generic plan, the loop took 2,552.5 ms and saveAll 2,474.5 ms, and 5,000 orders through the loop went from 1,814.6 ms to 692.6 ms.
So flush and clear bounds memory and does not speed anything up. It is the right rhythm for imports large enough to threaten the heap. When such an import into a small parent table slows down as it goes, read the plans of its foreign key checks with auto_explain before blaming Hibernate.
When to bypass JPA
For bulk loads nobody reads back as entities, PostgreSQL's COPY is the fastest path in. The driver's CopyManager streams CSV into a table over the transaction's own connection, and the ids come from the same sequences:
List<Long> orderIds = jdbc.sql("select nextval('orders_seq') from generate_series(1, :n)")
        .param("n", 2000).query(Long.class).list();
// order_lines_seq the same way, then build the CSV text for both tables
CopyManager copy = DataSourceUtils.getConnection(dataSource).unwrap(PGConnection.class).getCopyAPI();
copy.copyIn("copy orders (id, customer_id, placed_at) from stdin (format csv)", new StringReader(orderRows));
copy.copyIn("copy order_lines (id, order_id, product_id, quantity, unit_price) from stdin (format csv)", new StringReader(lineRows));
The same 2,000 orders and 8,000 lines took 63.7 ms, best of 5 at load 2.75, against 156.9 ms for the best JPA configuration. PGConnection is a driver class, so the dependency moves from runtimeOnly to implementation. It skips everything JPA does: no entity callbacks, no auditing, no cascade and no events. That is acceptable for a nightly load of a staging table, and a reason to keep JPA for anything that has business rules attached.
Read-only transactions for large reads
Reading 80,801 order lines as entities, three times per mode, showed no reliable difference in heap. The retained heap after System.gc() was 34.2 to 34.5 MB in a read-write transaction, 31.7 to 36.6 MB with @Transactional(readOnly = true), and 36.6 to 36.7 MB with Hibernate's read-only query hint, @QueryHints(@QueryHint(name = HibernateHints.HINT_READ_ONLY, value = "true")). Whatever read-only mode saves in memory was smaller than the run-to-run noise here. The commit did differ. In the read-write transaction, the commit took 66.4 to 79.8 ms after warm-up, almost all of it the flush that dirty-checked 80,801 entities. With readOnly = true it took 6.0 to 10.9 ms and the session metrics showed 0 flushes. With the hint alone the flush still visited all 80,801 entities, in 6.0 to 6.7 ms after warm-up. What readOnly changes in Spring and in Hibernate, and when to use it, is part of the next article.
Which tool for which JPA performance problem
| Symptom | Tool | Measured here |
|---|---|---|
| A list endpoint is slow and nobody knows why | org.hibernate.session.metrics=debug, a StatementInspector per request | 83 statements for one page |
| N+1 comes back after every change | A statement budget in an integration test | Failed at 83, passed at 3 |
| Lazy associations nobody planned for | hibernate.default_batch_fetch_size | 83 → 5 statements |
| A page of parents with their children | Two-query pattern, or JOIN FETCH when the query does not sort or filter by the children | 3 or 2 statements |
| A read-only list | Closed interface or record projection | 21 rows, 0 managed entities |
| A large import | SEQUENCE with allocationSize, batch_size, order_inserts, reWriteBatchedInserts | 1,372 → 157 ms |
| An import that outgrows the heap | flush and clear every few batches | 70.0 → 26.2 MB |
| A bulk load with no business rules | COPY | 63.7 ms |
FAQ
How do I detect N+1 queries in a Spring Boot test?
Register a Hibernate StatementInspector through a HibernatePropertiesCustomizer, collect the SQL per thread, and assert on the count in a MockMvc test. The test here failed with to be less than or equal to 3 but was 83 and listed every statement. generate_statistics is not enough: its query log showed 2 of the 83 statements, because lazy loads are not queries.
Why does generate_statistics not print Session Metrics any more?
Because Hibernate 7 moved the per-session block to the log category org.hibernate.session.metrics at DEBUG. generate_statistics=true alone printed nothing per session with Hibernate 7.4.5, and the old hibernate.session.events.log setting is deprecated and ignored. logging.level.org.hibernate.session.metrics=debug printed HHH000401 with the statement count, without generate_statistics.
What is the difference between @BatchSize and hibernate.default_batch_fetch_size?
Scope. @BatchSize on a collection batches that collection only: on the order page, the lines went from 20 statements to 1 and the 61 product statements stayed, 64 in total. On an entity class it batches proxies of that entity. default_batch_fetch_size=50 batches every lazy association at once: 5 statements. On PostgreSQL both send = any (?) with one array parameter, sized to the ids actually needed.
Does JOIN FETCH with a Pageable load everything into memory in Hibernate 7?
Not in the common case on Hibernate 7.4: it pages the parents in a derived table and joins the children to that page, 2 statements and 82 rows here. It still falls back to memory, with the warning HHH90003004, when the query sorts by a child column first; that query transferred 801 rows to show five orders. A paged fetch join filtered by the children fails on PostgreSQL with missing FROM-clause entry. The derived-table rewrite arrived in Hibernate ORM 7.4.0.
Is FetchMode.SUBSELECT safe with pagination?
No. The subquery Hibernate 7.4.5 generated, select o1_0.id from orders o1_0, left out the page's offset and limit, so a page of 20 orders loaded the lines of all 200: 801 rows instead of 81, and 922 rows for the request instead of 163.
Why does Hibernate disable JDBC batching for IDENTITY columns?
Because the id exists only after the row is inserted, and Hibernate needs it when persist returns. It sends each INSERT immediately and reads the key back, which the PostgreSQL driver does by appending RETURNING *. With batch_size=50 the session metrics still showed 10,000 statements and 0 batches. A SEQUENCE with allocationSize = 50 needed 200 nextval calls for 10,000 rows and allowed 200 batches.
Do interface projections select only the needed columns?
Closed ones do: ProductSummary with three getters produced select p1_0.id,p1_0.name,p1_0.price and left no entities in the persistence context. An open projection with @Value("#{target…}") selected all columns and left 13 managed entities, because the expression needs the entity.
Conclusion
A JPA performance problem is a count before it is a timing. The order page issued 83 statements, and the same number showed up in PostgreSQL's pg_stat_statements, in the org.hibernate.session.metrics block that Hibernate 7 logs instead of generate_statistics, and in a StatementInspector that a test can assert on. That test is the tool that keeps the fixes in place. Among the fixes, default_batch_fetch_size cut the page to 5 statements without touching a query, using one array parameter on PostgreSQL. SUBSELECT read the whole table for a page of 20. Hibernate 7.4 pages a fetch join in SQL unless the query sorts or filters by the children, and the two-query pattern handles those cases in 3 statements.
Reading less beat fetching better. A closed interface or record projection selected three columns and left nothing in the persistence context, an open SpEL projection did neither, and the record read model answered the order list with 21 rows. For writes, the key generator decides: IDENTITY meant 10,000 single INSERTs whatever the settings, while a pooled SEQUENCE with batch_size, order_inserts and reWriteBatchedInserts meant 600 multi-row INSERTs in less than an eighth of the time. Flush and clear bounded the heap for 100,000 rows and exposed a PostgreSQL plan on the way.
The next article is about transactions in depth: propagation, isolation levels, what readOnly really changes, and the rollback rules.
![[Advanced Spring Boot] Multi-Tenancy and Soft Delete with Spring Boot and Hibernate](/images/blog/sba-multi-tenancy-thumbnail.en.webp)
![[Advanced Spring Boot] Spring AOP: JDK and CGLIB Proxies, Aspects and Self-Invocation](/images/blog/sba-aop-thumbnail.en.webp)
![[Advanced Spring Boot] Writing Your Own Auto-configuration and Starter](/images/blog/sba-autoconfig-thumbnail.en.webp)
![[Advanced Spring Boot] Spring Transactions in Depth: Propagation, Isolation Levels and Rollback Rules](/images/blog/sba-transactions-thumbnail.en.webp)