"Best practices and interview preparation" is the easiest subject in programming to fill with recycled material: fifty bullet points everybody has already read, and twenty questions with a memorised sentence attached to each. This article follows a stricter rule instead. Every claim that can be demonstrated is demonstrated, with the program and its output; every claim that cannot is labelled as judgement and kept short.
That rule decides the shape of what follows. The performance section reports allocation bytes, equals() calls, compile() calls and SQL statements rather than milliseconds, because those numbers are reproducible and a stopwatch reading is not. The review checklist is a list of questions, each named after the defect it catches. And the interview section takes the questions usually answered with one confident sentence and answers them with a transcript.
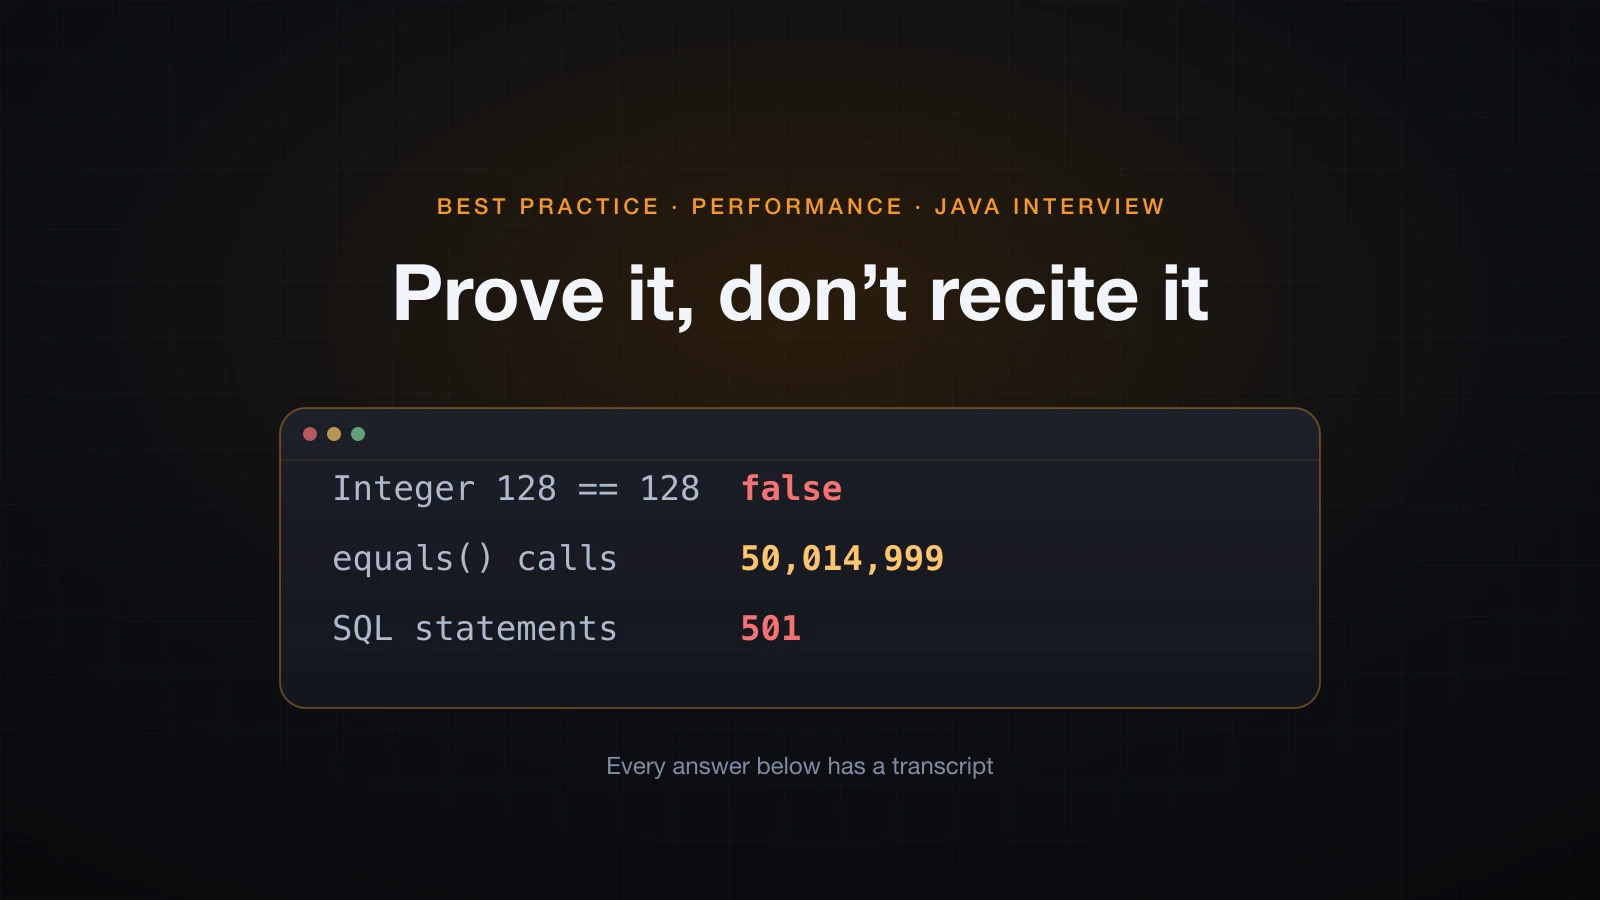
Every program, error message and number below was compiled and run on OpenJDK 21.0.6 (arm64). Nothing here is quoted from memory, and nothing here is a timing.
Measure, do not guess: why this course never published a benchmark number
Across the whole series there has not been a single "this is 3x faster" claim with a millisecond attached. That was deliberate, and this is the one place it gets explained.
A number in milliseconds is only meaningful together with the hardware, the JVM version, the flags, what else the machine was doing, and how many iterations ran before the measurement started. Strip any one of those away and the number stops being reproducible — which means the reader cannot check it, and neither can you next month. A count does not have that problem. The number of objects a loop allocates, the number of times equals() runs, the number of SQL statements a request issues: those are the same on a laptop and on a loaded CI machine, and they are the same today and next year.
What a nanoTime loop is actually measuring
The usual microbenchmark looks like this: take System.nanoTime(), run the method a million times, take nanoTime() again, divide. Here is the method under test.
public class Bench {
    static int work(int[] a) {
        int s = 0;
        for (int v : a) s += v * 31;
        return s;
    }

    public static void main(String[] args) {
        int[] a = new int[1000];
        for (int i = 0; i < a.length; i++) a[i] = i;
        long sink = 0;
        for (int i = 0; i < 200_000; i++) sink += work(a);
        System.out.println("sink=" + sink);
    }
}
Run it with the JIT compiler's log turned on and filter for that one method. The timestamp column is stripped here, because this article publishes no times:
java -XX:+PrintCompilation Bench 2>&1 \
| grep 'Bench::work' | sed -E 's/^[[:space:]]*[0-9]+[[:space:]]+//'6 % 3 Bench::work @ 10 (38 bytes)
7 3 Bench::work (38 bytes)
8 % 4 Bench::work @ 10 (38 bytes)
6 % 3 Bench::work @ 10 (38 bytes) made not entrant
9 4 Bench::work (38 bytes)
7 3 Bench::work (38 bytes) made not entrantRead that carefully. The same 38-byte method was compiled at tier 3, then compiled again at tier 4, and the tier-3 versions were then thrown away — that is what made not entrant means. The % marks an on-stack replacement, a compilation installed into a loop that was already running. A single timing loop over this method therefore measured the interpreter, then one compiler's output, then another compiler's output, and averaged them into one number.
That is only the first problem. The others are worse, because they are silent:
- Dead code elimination. If nothing consumes the result, the JIT is entitled to delete the work. Your loop then measures an empty loop.
- Constant folding. If the input is a compile-time constant, the whole computation can be replaced by its result.
- GC. A collection that happens to land inside the measured window is charged to whichever iteration was running.
- Everything else on the machine. Another process, another container, a background build.
JMH — the Java Microbenchmark Harness, from the OpenJDK project itself — exists precisely because of this list. It forks a fresh JVM, runs warm-up iterations that are not measured, consumes results through a blackhole so they cannot be eliminated, and reports error bars rather than a single number. If you genuinely need a timing, that is the tool. No JMH result appears in this article, because this article does not publish timings at all.
The tools that beat intuition
Two of them cover most real cases, and neither is a timer.
jcmd talks to a running JVM. Point it at a process that is misbehaving and ask what is on its heap:
jcmd <pid> GC.class_histogram num #instances #bytes class name (module)
-------------------------------------------------------
1: 47872 21779960 [B (java.base@21.0.6)
2: 21020 672640 java.util.HashMap$Node (java.base@21.0.6)
3: 27791 666984 java.lang.String (java.base@21.0.6)
4: 1535 189696 java.lang.Class (java.base@21.0.6)
5: 322 182664 [Ljdk.internal.vm.FillerElement; (java.base@21.0.6)
6: 264 155456 [Ljava.util.HashMap$Node; (java.base@21.0.6)
7: 1116 131144 [Ljava.lang.Object; (java.base@21.0.6)Twenty-one thousand HashMap$Node instances and twenty-one megabytes of byte arrays. Nobody had to guess: the process is holding a map of byte arrays, and the next question is who owns that map. jcmd <pid> Thread.print does the same job for a hang, and jcmd <pid> JFR.start records a Flight Recorder profile when you need call sites rather than counts.
The second tool is a counter you can put in your own program. HotSpot tracks how many bytes each thread has allocated, and exposes it through the com.sun.management extension of ThreadMXBean:
import com.sun.management.ThreadMXBean;
import java.lang.management.ManagementFactory;

public class Alloc {
    static final ThreadMXBean BEAN = (ThreadMXBean) ManagementFactory.getThreadMXBean();

    public static long bytes() { return BEAN.getCurrentThreadAllocatedBytes(); }
}
Take the counter before and after a piece of work and the difference is how much garbage that work produced. It is unaffected by other processes, it does not need a warm-up, and — as the next section shows — it is reproducible to the byte.
Six performance traps, every one of them counted
These six are common, they are real, and each one has a counter that identifies it. The picture below is the diagnostic path: what you observe, the counter that turns the observation into a number, and what that number points at.
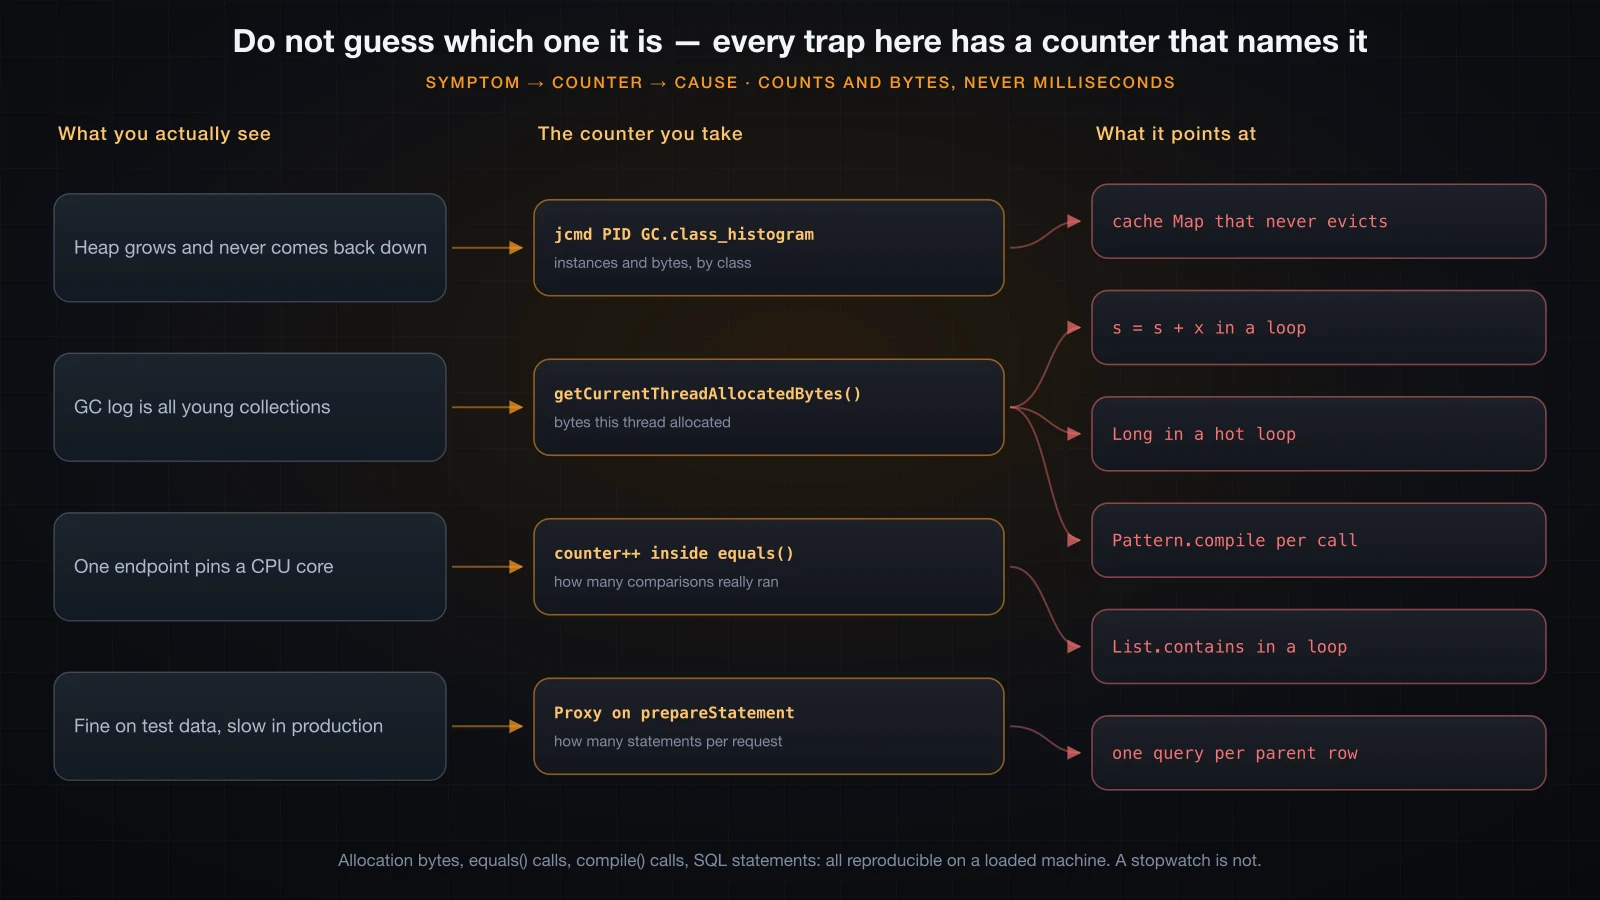
Each trap below ends with the same question — how would you know this one is yours? — because guessing which trap you have is the actual mistake. Fixing the wrong one costs you a day and changes nothing.
1. Building a String in a loop
String is immutable, so s = s + x cannot append. It builds a new string containing everything that came before plus the new piece, and throws the old one away. Do that inside a loop and the work is quadratic in the length of the result.
import com.sun.management.ThreadMXBean;
import java.lang.management.ManagementFactory;

public class ConcatTrap {
    static final ThreadMXBean B = (ThreadMXBean) ManagementFactory.getThreadMXBean();

    static String withConcat(int n) {
        String s = "";
        for (int i = 0; i < n; i++) s = s + "row" + i + ";";
        return s;
    }

    static String withBuilder(int n) {
        StringBuilder sb = new StringBuilder();
        for (int i = 0; i < n; i++) sb.append("row").append(i).append(';');
        return sb.toString();
    }

    public static void main(String[] args) {
        int n = 20_000;
        long a = B.getCurrentThreadAllocatedBytes();
        String s1 = withConcat(n);
        long b = B.getCurrentThreadAllocatedBytes();
        String s2 = withBuilder(n);
        long c = B.getCurrentThreadAllocatedBytes();

        System.out.println("same result      : " + s1.equals(s2));
        System.out.println("result length    : " + s1.length());
        System.out.println("concat  allocated: " + (b - a) + " bytes");
        System.out.println("builder allocated: " + (c - b) + " bytes");
        System.out.println("ratio            : " + ((b - a) / (c - b)) + "x");
    }
}same result : true
result length : 168890
concat allocated: 1629562776 bytes
builder allocated: 759224 bytes
ratio : 2146xTwo identical strings of 168,890 characters. One cost 1.63 GB of allocation, the other 759 KB. That figure is byte-identical on every run, which is exactly why it is worth quoting.
It is worth being precise about what the compiler does and does not fix. javac on Java 21 compiles s + "row" + i + ";" into a single invokedynamic that calls into StringConcatFactory, so the concatenation within one statement is already efficient:
12: invokedynamic #9, 0 // InvokeDynamic #0:makeConcatWithConstants:(Ljava/lang/String;I)Ljava/lang/String;What it cannot fix is that the statement runs 20,000 times and each run has to copy the entire accumulated string. The trap is the loop, not the plus sign. Concatenating two or three values in one statement is fine and always has been.
How would you know it is yours? The allocation counter around the suspect method, or jcmd GC.class_histogram showing an enormous [B count with a modest live set — a lot of garbage, produced and immediately discarded.
2. The wrong collection for the access pattern
List.contains is a linear scan. Set.contains is a hash lookup. The difference does not show up in a code review as a bug, because both lines read the same. Instrument equals() and it becomes impossible to miss.
import java.util.*;

public class CollectionTrap {
    static long equalsCalls = 0;

    record Sku(String code) {
        @Override public boolean equals(Object o) {
            equalsCalls++;
            return o instanceof Sku s && s.code.equals(code);
        }
        @Override public int hashCode() { return code.hashCode(); }
    }

    public static void main(String[] args) {
        int size = 10_000, lookups = 1_000;
        List<Sku> list = new ArrayList<>();
        for (int i = 0; i < size; i++) list.add(new Sku("SKU-" + i));
        Set<Sku> set = new HashSet<>(list);

        List<Sku> wanted = new ArrayList<>();
        for (int i = 0; i < lookups; i++) wanted.add(new Sku("SKU-" + (i * 7 % size)));

        equalsCalls = 0;
        int hitsList = 0;
        for (Sku s : wanted) if (list.contains(s)) hitsList++;
        long listCalls = equalsCalls;

        equalsCalls = 0;
        int hitsSet = 0;
        for (Sku s : wanted) if (set.contains(s)) hitsSet++;
        long setCalls = equalsCalls;

        System.out.println("hits            : list=" + hitsList + " set=" + hitsSet);
        System.out.println("ArrayList equals: " + listCalls);
        System.out.println("HashSet   equals: " + setCalls);
        System.out.println("ratio           : " + (listCalls / setCalls) + "x");
    }
}hits : list=1000 set=1000
ArrayList equals: 3497500
HashSet equals: 1000
ratio : 3497xSame 1,000 answers. One version asked 3,497,500 questions to get them; the other asked exactly 1,000, one per lookup. And the gap widens with the data: it is the product of the number of lookups and the size of the list, so ten times the catalogue is ten times the work.
How would you know it is yours? A counter inside equals() for a few seconds, or a profiler where equals and indexOf sit at the top of a hot endpoint. The tell in the code is a contains, indexOf or remove(Object) on a List inside a loop.
3. Autoboxing in a hot loop
Long is an object. long is not. Accumulating into the wrong one allocates once per iteration.
static long boxed(int n) {
    Long sum = 0L;                 // the trap: one Long per iteration
    for (int i = 0; i < n; i++) sum += i;
    return sum;
}

static long primitive(int n) {
    long sum = 0L;
    for (int i = 0; i < n; i++) sum += i;
    return sum;
}same result : true (499999500000)
Long allocated : 24000056 bytes
long allocated : 0 bytes
bytes per iteration: 24Twenty-four bytes per iteration, one million iterations, 24 MB of garbage — and the primitive version allocates literally nothing. The bytecode shows why: every sum += i is a longValue() to unbox, an add, and a Long.valueOf to box the result again.
13: invokevirtual #13  // Method java/lang/Long.longValue:()J
16: iload_2
17: i2l
18: ladd
19: invokestatic  #7   // Method java/lang/Long.valueOf:(J)Ljava/lang/Long;
The same thing happens to a Map<String, Integer> counter incremented in a loop, and to a List<Integer> used as a numeric buffer. It does not happen for small values of Integer, Short, Byte and Character, because those have a cache — which is the subject of the first interview question below.
How would you know it is yours? The allocation counter around the loop, or a histogram dominated by java.lang.Long / java.lang.Integer instances. Note that this is a garbage problem, not a live-heap problem: the objects die immediately, so the heap does not grow.
4. The cache that never evicts
A HashMap that only ever gains entries is not a cache. It is a memory leak with a friendly name, and it fails in the most abrupt way of any trap here.
import java.util.*;

public class CacheLeak {
    // A "cache" that never evicts is a Map field that only ever grows.
    static final Map<String, byte[]> CACHE = new HashMap<>();
    static int inserted = 0;

    public static void main(String[] args) {
        try {
            for (int i = 0; ; i++) {
                CACHE.computeIfAbsent("page-" + i, k -> new byte[16 * 1024]);
                inserted++;
            }
        } catch (OutOfMemoryError e) {
            CACHE.clear();                      // free the heap before printing
            System.out.println("entries cached before it died: " + inserted);
            System.out.println(e);
        }
    }
}java -Xmx64m CacheLeakentries cached before it died: 3938
java.lang.OutOfMemoryError: Java heap spaceRoughly 3,900 entries at 16 KB each, and the process is gone. The exact number moves by a handful between runs; the outcome does not. Note that catching OutOfMemoryError here is a demonstration device, not advice — the CACHE.clear() on the next line is what makes it possible to print anything at all.
The fix is not a bigger heap. It is a bound and an eviction policy. LinkedHashMap has one built in:
static final int MAX = 500;
static final Map<String, byte[]> CACHE = new LinkedHashMap<>(16, 0.75f, true) {
    @Override protected boolean removeEldestEntry(Map.Entry<String, byte[]> e) {
        return size() > MAX;
    }
};inserted : 1000000
cache size: 500
survived : yes, same -Xmx64mA million insertions under the same 64 MB heap, ending with 500 entries. The third argument true makes it order by access, so the entry evicted is the least recently used one. In a real service you would more often reach for Caffeine or your framework's cache abstraction, which add size limits, time-based expiry and statistics — but the property that matters is the one shown here: a maximum.
How would you know it is yours? The heap grows and never comes back down after a full GC, and jcmd GC.class_histogram shows a large HashMap$Node count. A heap dump then names the field holding it.
5. Recompiling the same regex on every call
Compiling a regular expression builds a small state machine. Doing it inside a loop rebuilds that machine every time. This one is easy to prove twice over: once by counting the calls, and once by reading the JDK source.
import java.util.regex.Pattern;

public class RegexTrap {
    static int compiles = 0;                          // instrumented wrapper

    static Pattern compile(String regex) {            // every compile goes through here
        compiles++;
        return Pattern.compile(regex);
    }

    static final String RE = "^[A-Z]{2}-\\d{4}-[a-z]+$";
    static final Pattern CACHED = compile(RE);        // compiled once, at class init

    static boolean recompiling(String s) { return compile(RE).matcher(s).matches(); }
    static boolean cached(String s) { return CACHED.matcher(s).matches(); }
    // ... 10,000 inputs through each, with the allocation counter around both loops
}compiles after class init : 1
matches (all three) : 10000 / 10000 / 10000
compiles after loop 1 : 10001
compiles after loop 2 : 10001
allocated, recompiling : 16269544 bytes
allocated, cached Pattern : 2080000 bytes
allocated, String.matches : 16000000 bytesThe counter is unambiguous: the naive loop compiled the pattern 10,000 times, and the loop using the static final Pattern compiled it zero more times — the single compile it needed happened once at class initialisation. Same answers, nearly eight times the allocation.
The third line matters because String.matches looks innocent. It is not a different path; it is the same one. From String.java in the JDK's own src.zip:
public boolean matches(String regex) {
    return Pattern.matches(regex, this);
}
and from Pattern.java:
public static boolean matches(String regex, CharSequence input) {
    Pattern p = Pattern.compile(regex);
    Matcher m = p.matcher(input);
    return m.matches();
}
Pattern.compile on every single call, by construction. String.matches and String.split in a loop are the two places this hides.
How would you know it is yours? The allocation counter, or a profiler showing time in Pattern$Node construction. In code review the tell is any Pattern.compile, .matches( or .split( that is not on a static final field.
6. One query per parent row
The N+1 problem is not an ORM problem — an ORM just makes it easy to write by accident. Plain JDBC has the same shape, and a counting proxy makes the shape visible.
import java.lang.reflect.*;
import java.sql.*;

public class NPlusOne {
    static int statements = 0;

    /** Counts every statement this connection is asked to prepare. */
    static Connection counting(Connection real) {
        return (Connection) Proxy.newProxyInstance(
                Connection.class.getClassLoader(),
                new Class<?>[]{Connection.class},
                (proxy, m, args) -> {
                    if (m.getName().equals("prepareStatement")) statements++;
                    return m.invoke(real, args);
                });
    }
    // ... load 5 customers, then their orders one customer at a time
}N+1 version : 6 statements, 20 order rows
join version : 1 statements, 20 order rowsSix statements for five customers, one for the join. The Java in the first version reads perfectly — a loop over customers, a query inside it — and the database sees six round trips. Scale the parent table and the shape is exactly what the name says:
5 customers -> 6 statements
50 customers -> 51 statements
500 customers -> 501 statements
That is the whole danger of this one. It is invisible on the ten rows in your test fixture and it is a production incident on fifty thousand.
How would you know it is yours? Count statements per request. A proxy on Connection as above, spring.jpa.show-sql with the log lines counted, or your database's own statement log. If the count scales with the number of rows in a previous result, you have found it.
A code review checklist that catches defects, not style
Formatting is not worth a review comment; a formatter settles it. What is worth a comment is the class of defect that compiles cleanly, passes the tests you have, and then behaves badly somewhere you are not watching. The picture below plots eight such questions against the stage where the defect would surface if nobody asked.
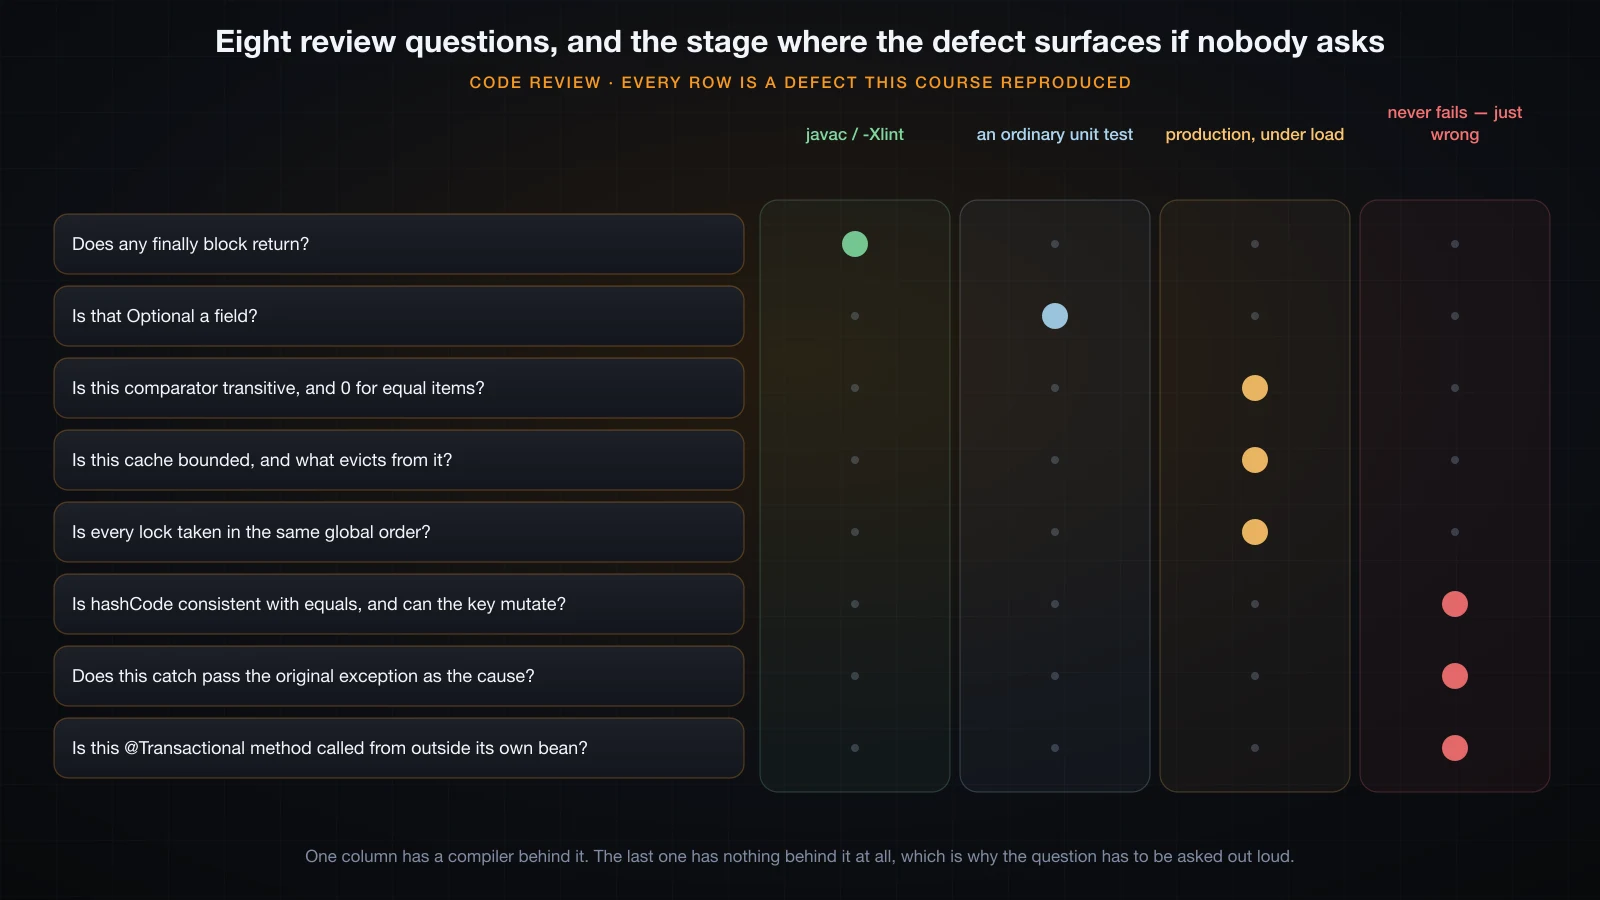
The shape of that picture is the argument. One of the eight has a compiler flag behind it. One fails the first time an ordinary test exercises it. Three wait for load or for scale. And three never throw anything at all — they just quietly produce the wrong answer, which is why they have to be caught by a human reading the diff.
Four of them, running
A key whose hash can change. equals and hashCode agree here, so a review that only checks "are they consistent" passes it. The field they are built from is mutable, and that is enough.
static final class Order {
    int id;                                   // not final: that is the defect
    Order(int id) { this.id = id; }
    @Override public boolean equals(Object o) { return o instanceof Order x && x.id == id; }
    @Override public int hashCode() { return Integer.hashCode(id); }
}contains before the change : true
contains after the change : false
remove(o) succeeded : false
entries still in the set : 1The set still holds the object, and the set can no longer find it — not with contains, not with remove, not even with the very reference that was added. The entry is unreachable and permanent. No exception is thrown, ever. The review question is can the field this hash is built from ever change?, and the fix is final.
A comparator that is not a total order. Two versions of the same defect, and neither is caught by a test on small data.
List<Integer> v = List.of(Integer.MIN_VALUE, 1, Integer.MAX_VALUE, -1, 0);
subtraction.sort((a, b) -> a - b);      // overflows, silently
compare.sort(Integer::compare);(a, b) -> a - b : [-1, 0, 1, 2147483647, -2147483648]
Integer::compare : [-2147483648, -1, 0, 1, 2147483647]
n=100 : sorted, no complaint
n=1000 : sorted, no complaint
n=10000 : IllegalArgumentException: Comparison method violates its general contract!The subtraction comparator put Integer.MAX_VALUE before Integer.MIN_VALUE and reported no error: a - b overflowed. And the non-transitive comparator in the second half sorted 100 elements and 1,000 elements without a word, then threw at 10,000 — because TimSort only notices when a merge invariant actually breaks, which needs enough data. A comparator bug is a bug that waits for your production data size.
A catch that drops the cause, and an Optional used as a field.
catch (NumberFormatException e) { throw new IllegalStateException("bad config"); }
catch (NumberFormatException e) { throw new IllegalStateException("bad config", e); }thrown : java.lang.IllegalStateException: bad config
cause : null
thrown : java.lang.IllegalStateException: bad config
cause : java.lang.NumberFormatException: For input string: "x1"
serialise: java.io.NotSerializableException: java.util.OptionalThe first form is the one you will meet at 3am: a stack trace that tells you the config is bad and nothing at all about which value or why. One extra argument keeps the original. The last line is the Optional field: Optional deliberately does not implement Serializable, so a serialisable class holding one fails the moment anything writes it out. Optional is a return type; a field wants a plain nullable value or an empty collection.
The eight questions, and the failure each one catches
| Ask in review | What it catches | How it shows up |
|---|---|---|
Does any finally block return or throw? | The finally discards the exception in flight | Silent loss of the real error; javac -Xlint:finally warns |
Is that Optional a field rather than a return type? | Optional is not Serializable | NotSerializableException on the first write |
| Is this comparator transitive, and does it return 0 for equal items? | A broken total order | Wrong order silently, then IllegalArgumentException at scale |
| Is this cache bounded, and what evicts from it? | A Map that only grows | Heap climbs, then OutOfMemoryError |
| Is every lock acquired in the same global order? | A lock cycle between two threads | The process stops responding, with no exception |
Is hashCode consistent with equals, and can the key mutate? | An entry that becomes unreachable | contains returns false for an object the set holds |
Does this catch pass the original exception as the cause? | A truncated stack trace | You debug the wrong layer for an hour |
Is this @Transactional method called from outside its own bean? | Proxy bypassed by self-invocation | No transaction starts; nothing rolls back |
Two more that belong on the list but are covered by earlier articles rather than re-run here: does every stream over a directory get closed (an unclosed Files.list holds a file descriptor until the process runs out of them), and does this Stream get consumed exactly once (a second terminal operation throws IllegalStateException).
None of these are style. Every one of them is a defect that ships.
Java interview preparation: a map, not a script
Interview questions are not random, but they are not a numbered list either. They cluster by area, and which areas come up depends on the role — that part is judgement. What each area actually demands is not judgement; it is the material.
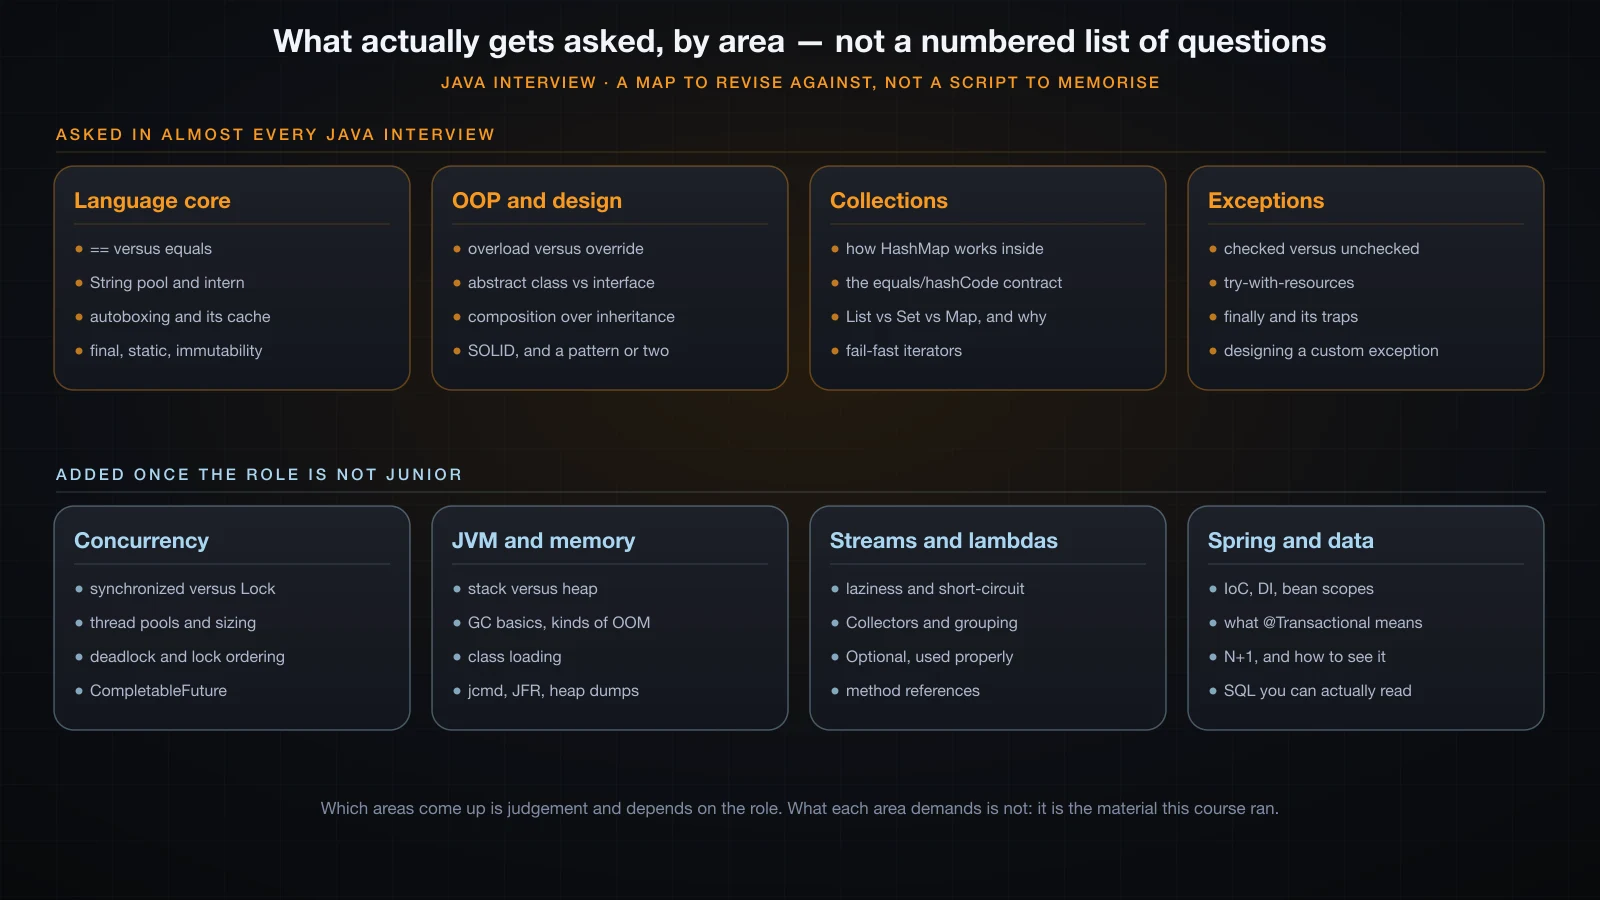
Revise against a map like that rather than against a list of questions, because the follow-up is where interviews are decided. "What is the difference between HashMap and Hashtable" has a memorised answer; "so what happens when two keys collide" does not.
The rest of this section takes questions that are usually answered with one sentence and answers them with a program instead. An answer with a transcript beats an answer with confidence, and running the demonstration once is also how you remember it.
Why == and equals disagree about Integer at 128
The sentence people memorise is "Java caches small Integers". Here is the demonstration, and the part that makes it interesting.
public class IntegerCache {
    public static void main(String[] args) {
        Integer a = 127, b = 127;
        Integer c = 128, d = 128;
        System.out.println("127 == 127      : " + (a == b));
        System.out.println("128 == 128      : " + (c == d));
        System.out.println("128.equals(128) : " + c.equals(d));
        System.out.println("valueOf identity: " + (Integer.valueOf(128) == Integer.valueOf(128)));
    }
}127 == 127 : true
128 == 128 : false
128.equals(128) : true
valueOf identity: falseNow the follow-up almost nobody has ready. That boundary is not a language rule — it is a cache size, and it is tunable:
java -XX:AutoBoxCacheMax=1000 IntegerCache127 == 127 : true
128 == 128 : true
128.equals(128) : true
valueOf identity: trueThe same source code, the same JDK, a different answer. Autoboxing goes through Integer.valueOf, which returns a shared instance for values inside the cache and a fresh object outside it; the upper bound of that cache defaults to 127 and is set by a flag. The flag is Integer-only, incidentally:
Integer 128 : false
Long    128 : false
Short   128 : false
Character128: false
Boolean : trueLong, Short and Character keep their fixed caches; Boolean has only two values and always returns the same two. The real answer to the question is therefore not "127 is the limit" but "never compare boxed types with ==, because whether it works is not a property of your code".
What a lazy hashCode costs, in equals calls
"A constant hashCode is legal but bad" is the memorised half. The interesting half is how bad, and that is countable: put a counter in equals and compare a proper hash against return 42.
static final class Bad {
    final int id;
    Bad(int id) { this.id = id; }
    @Override public boolean equals(Object o) {
        equalsCalls++;
        return o instanceof Bad b && b.id == id;
    }
    @Override public int hashCode() { return 42; }   // legal, and ruinous
}size : good=10000 bad=10000
equals on add : good=0 bad=50116881
equals on get : good=10000 bad=50014999Ten thousand elements. With a real hash, building the set called equals zero times — distinct hashes land in distinct buckets, so there is nothing to compare against — and looking every element up called it exactly 10,000 times, once each. With the constant hash, the same work cost over fifty million comparisons in each direction.
The reason is that the contract was not violated, so nothing complains: equal objects still have equal hash codes. HashSet simply degenerates into a linear scan, because every entry is in the same bucket. That is the answer worth giving — not "it is slower" but "it silently turns your O(1) lookup back into O(n), and the contract check will not catch it".
Is String immutable, and what the pool has to do with it
Immutability and the string pool are two different things that get answered as one. Separating them is easy to do out loud with this output.
literal  == literal : true
literal  == new     : false
literal  == intern  : true
literal  == folded  : true
literal  == runtime : false
equals everywhere   : true
toUpperCase changed : SHOP, new object = true
no-op toUpperCase   : same object returned = true
substring(0)        : same object returned = true
concat("")          : same object returned = true
The first block is the pool: identical literals are the same object, new String("shop") deliberately is not, intern() gets you back to the pooled one, "sh" + "op" is folded by javac into a literal, and the same concatenation built from a variable at runtime is a new object. equals is true throughout, which is the point — identity and equality are different questions.
The last four lines are immutability, and they contain a detail worth having. "shop".toUpperCase() returns a new object because something changed. "SHOP".toUpperCase(), "shop".substring(0) and "shop".concat("") all return the very same object, because nothing changed and the JDK is free to hand back this. That optimisation is only sound because the class is immutable — which is the strongest way to say what immutability actually buys.
What synchronized compiles to
Everyone knows synchronized locks. Fewer people know the two forms compile to entirely different things, and javap settles it in one command. The class:
public class SyncShape {
    private final Object lock = new Object();
    private int n;

    synchronized void method() { n++; }

    void block() {
        synchronized (lock) { n++; }
    }
}
The synchronized method contains no locking instructions at all:
  synchronized void method();
    Code:
       0: aload_0
       1: dup
       2: getfield      #13    // Field n:I
       5: iconst_1
       6: iadd
       7: putfield      #13    // Field n:I
10: return synchronized void method();
descriptor: ()V
flags: (0x0020) ACC_SYNCHRONIZEDThe lock is a flag in the method's access modifiers, and the JVM acquires the monitor on entry and releases it on exit — including on an exception — as part of invoking the method. The synchronized block is the opposite: real instructions, and an exception table whose only job is to unlock on the way out.
  void block();
    Code:
       0: aload_0
       1: getfield      #7     // Field lock:Ljava/lang/Object;
       4: dup
       5: astore_1
       6: monitorenter
       7: aload_0
       ...
      17: aload_1
      18: monitorexit
      19: goto          27
      22: astore_2
      23: aload_1
      24: monitorexit
      25: aload_2
      26: athrow
      27: return
    Exception table:
       from    to  target type
           7    19    22   any
          22    25    22   any
Two monitorexit instructions for one monitorenter: one on the normal path, one in the handler that catches anything and rethrows it after unlocking. That is also the concrete answer to "which object does a synchronized method lock?" — the instance for an instance method, the Class object for a static one, because that is what the JVM passes to the monitor when it sees the flag.
Does finally always run
The memorised answer is yes. The correct answer is "almost always, and here are the two exceptions, one of which is a bug you should be looking for in review".
static int normal() {
    try { return 1; } finally { System.out.println("  finally ran"); }
}

static int swallows() {
    try { throw new IllegalStateException("the real cause"); }
    finally { return 2; }          // discards the exception entirely
}

static void exits() {
    try { System.exit(0); } finally { System.out.println("  never printed"); }
} finally ran
normal() -> 1
swallows() -> 2
exits():Three results in one transcript. normal() shows the ordinary case: the finally runs after the return value is computed and before the method actually returns. swallows() returned 2 and the IllegalStateException vanished — a return inside finally discards whatever was in flight, exception included. And exits() printed nothing after its heading and the program ended right there; the line after the call never ran either, because System.exit does not unwind the stack.
javac will tell you about the second one if you ask it to:
javac -Xlint:finally FinallyFacts.javaFinallyFacts.java:8: warning: [finally] finally clause cannot complete normally
finally { return 2; } // discards the exception entirely
^
1 warningThe other ways out are Runtime.halt, a JVM crash, and a power cut. Everything else — including a thread being interrupted or an Error propagating — runs the finally.
What this refers to inside a lambda
"A lambda is just shorthand for an anonymous class" is the wrong answer, and one line of output disproves it.
Runnable anon = new Runnable() {
    @Override public void run() {
        System.out.println("anonymous this : " + this.getClass().getName());
    }
};
Runnable lambda = () ->
System.out.println("lambda this : " + this.getClass().getName() + ", name=" + name);anonymous this : LambdaThis$1
lambda this : LambdaThis, name=outer
lambda object : LambdaThis$$Lambda/0x000000c001000c20Inside the anonymous class, this is the anonymous class instance. Inside the lambda, this is the enclosing object — a lambda has no this of its own and does not introduce a new scope, which is also why it can read name directly and why a lambda cannot shadow a variable from its enclosing method.
The class names show the other half of the difference. LambdaThis$1 is a real class file; the lambda's type is spun at runtime by LambdaMetafactory and has no class file at all. Compile the source and count what lands on disk:
LambdaThis$1.class
LambdaThis.class
Two files for a class that contains one anonymous class and one lambda. The hexadecimal suffix in the lambda's name differs on every run, which is a good hint that nothing on disk produced it.
Does Stream.toList() accept null
This one separates people who have used Stream.toList() from people who have read about it. There are three list collectors and they differ in two dimensions.
Stream.toList() with null    : [a, null, b]
its class                    : java.util.ImmutableCollections$ListN
Stream.toList() then add      : java.lang.UnsupportedOperationException
Collectors.toUnmodifiableList : java.lang.NullPointerException
Collectors.toList() class    : java.util.ArrayList
Collectors.toList() then add  : ok
after add                    : [a, null, b, c]
Stream.toList() (Java 16) returns an unmodifiable list that does allow nulls. Collectors.toUnmodifiableList() (Java 10) returns an unmodifiable list that does not — it throws NullPointerException while collecting. Collectors.toList() gives you a plain mutable ArrayList and promises nothing about its type in the specification.
So "use toList(), it is shorter" is true but incomplete. The correct summary is that toList() is unmodifiable and null-tolerant, toUnmodifiableList() is unmodifiable and null-hostile, and Collectors.toList() is the only one you can add to.
What to say when you do not know
This one is judgement, not measurement, and it is short. Say you do not know, then say how you would find out — and be specific: "I would check with javap", "I would count the statements with show-sql", "I would take a class histogram with jcmd". That is a better answer than a wrong recital, and it is the same sentence you would say to a colleague. An interviewer who penalises it is telling you something useful about the job.
Career advice, clearly labelled as opinion
Nothing in this section was measured. It is opinion, formed from watching what separates developers who keep getting better from developers who plateau, and you should weigh it as such.
Read the JDK source. It ships with the JDK, in lib/src.zip, and your IDE will open it if you point it there. The String.matches answer earlier in this article took thirty seconds to confirm and would otherwise have been a guess. ArrayList, HashMap, Optional, AbstractQueuedSynchronizer — these are ordinary Java written by careful people, and reading them is the fastest way to stop treating the library as magic.
Learn SQL properly. More Java performance problems live in the database than in the Java. An ORM removes the row-mapping code; it does not remove the need to read an execution plan, know what an index does, or notice that a request issued 501 statements. This is the single highest-return skill adjacent to Java.
Knowing why beats knowing what. Knowing that HashMap is O(1) is worth little; knowing what makes it O(n) — and that a constant hashCode costs fifty million comparisons, because you counted them — is worth a great deal. The first kind of knowledge answers a quiz. The second kind survives contact with a production incident, and it transfers to the next language you learn.
FAQ
Is Java slow?
Not in the way the question implies. Startup is slower than a native binary and every object has a header, but HotSpot's JIT compiles hot code to machine code with profile information a static compiler does not have. The performance problems you will actually meet are the ones in this article: allocation in a loop, the wrong data structure, and the database — not the language.
Should I use JMH for every performance question?
No. Use it when you genuinely need to compare two implementations of the same small piece of code. For "why is this endpoint slow", a profiler, a class histogram and a statement count get you there faster, and they measure the real system rather than a synthetic loop.
Is String concatenation with + always bad?
No. Inside one statement it compiles to a single invokedynamic and is fine. Inside a loop it is quadratic, because each iteration copies everything accumulated so far. Loop means StringBuilder; single statement means + is fine.
How many Java interview questions should I memorise?
None as sentences. Pick the areas from the topic map and, for each one, run the demonstration once — the Integer cache boundary, the javap output for synchronized, the equals counter for a bad hashCode. Ten minutes of running something is worth more than an hour of reading answers, and it survives the follow-up question.
What is the difference between Stream.toList() and Collectors.toList()?
Stream.toList() returns an unmodifiable list that allows null elements. Collectors.toList() returns a mutable list — an ArrayList on OpenJDK 21, though the specification does not promise the type. If you need unmodifiable and null-rejecting, that is Collectors.toUnmodifiableList(), which throws NullPointerException on a null element.
Does a finally block always execute?
It runs on every normal and exceptional exit from the try. It does not run if the JVM stops first — System.exit, Runtime.halt, a crash. And be careful with return inside a finally: it silently discards an exception that was propagating. Turn on javac -Xlint:finally to be told about that one.
How do I find a memory leak in a Java application?
Confirm it first: the heap should not return to its baseline after a full GC. Then jcmd <pid> GC.class_histogram for the class that is accumulating, then a heap dump — jcmd <pid> GC.heap_dump file.hprof — opened in Eclipse MAT or VisualVM to find which field holds the reference. In practice the answer is usually a collection that only ever gets added to.
What should I say when the interviewer asks about my weaknesses in Java?
Answer with something specific and true, and name what you did about it. "I had not worked with virtual threads until recently, so I read the JEP and ported a small service" is a real answer. A rehearsed non-weakness is not, and interviewers have heard it.
Conclusion
The rule this article followed is the one worth taking away from it: express a performance claim as a count, not a duration. Allocation bytes, equals() calls, compile() calls, SQL statements — 1.63 GB against 759 KB, 3,497,500 comparisons against 1,000, 501 statements against 1 — every one of those was reproducible on a busy machine, and none of them needed a stopwatch. Guessing which trap you have is the actual mistake; the counter that names it always exists, and it is usually two lines of code away.
That also closes both courses. Java Basics started from what Java is and why it needs a JVM, and went through the compile-and-run cycle, variables and types, operators and casting, strings, input, conditionals and loops, arrays in one and two dimensions, methods with their parameters, overloads, scope and recursion, then the object-oriented core — classes and objects, constructors, this, static and final, encapsulation, inheritance, polymorphism, abstract classes and interfaces — then exceptions, the first collections, reading and writing files, a console project, and the clean-code habits that make the rest readable.
Advanced Java picked it up from there: the four OOP principles at depth, nested and anonymous classes, enums with behaviour, generics and erasure, SOLID and the design patterns you meet in real codebases; the collections framework properly, with Set, Map, Deque and PriorityQueue, iterators, comparators and the Collections utilities; streams, lambdas, functional interfaces and Optional; concurrency from threads and synchronized through executors, CompletableFuture and deadlock; I/O and NIO, JSON, JDBC and connection pooling; JUnit 5, Mockito, debugging and logging; Maven and Gradle, layered architecture, Spring Boot, REST and Spring Data JPA; and finally a complete sales API built and tested end to end.
Concretely, seventy-five articles later: you can design a class hierarchy and defend the choice between an interface and an abstract class; pick a collection from its access pattern and say what it costs; write a stream pipeline and know when a loop is clearer; run work on a thread pool without corrupting shared state, and recognise a deadlock from a thread dump; read and write files and JSON; talk to a database through JDBC or JPA and see the SQL it issues; test all of it with JUnit and Mockito; build it with Maven or Gradle; and put it behind a Spring Boot REST API. That is a working Java developer's toolkit, not a beginner's.
What is not here is equally worth saying plainly. Seventy-five articles do not make anyone senior — that comes from maintaining code you wrote a year ago, in a system with real users and real data. There is no sequel to this series. What comes next is a project of your own, the JDK source when something surprises you, and the habit these articles were built on: when you are not sure, run it and read the output.
![[Advanced Java] Iterator, ListIterator, and Fail-Fast versus Fail-Safe Iteration](/images/blog/iterator-thumbnail.en.webp)
![[Advanced Java] Connection Pooling in Java with HikariCP](/images/blog/hikaricp-thumbnail.en.webp)
![[Advanced Java] Thread Lifecycle, synchronized and Race Conditions](/images/blog/thread-lifecycle-thumbnail.en.webp)
![[Advanced Java] SOLID Principles in Java: Five Rules and When to Break Them](/images/blog/solid-thumbnail.en.webp)