A log line is the only evidence that survives a request. The stack frame is gone, the heap is gone, the user has left — what remains is whatever the process wrote down while it was still running. That makes logging a design decision rather than a debugging afterthought, and Java's logging stack has one structural quirk that trips up almost everyone the first time: the API you write against contains no code that prints anything.
This article covers both halves of the title. First logging: the facade pattern behind SLF4J, what the levels are actually for, why the placeholder syntax exists, how to configure Logback and Log4j 2, structured logging with MDC, and how to log an exception without destroying its stack trace. Then debugging: reading a stack trace correctly, setting breakpoints from the command line, and inspecting a JVM that is already running.
Everything below was compiled and run on OpenJDK 21.0.6 (arm64) with slf4j-api 2.0.13, slf4j-simple 2.0.13, logback-classic and logback-core 1.5.12, and Log4j 2.24.1 (log4j-api, log4j-core, log4j-slf4j2-impl). Every log line, warning and stack trace quoted here is a verbatim capture from those runs.
Why System.out.println stops being enough
System.out.println is a fine way to look at a value while you are writing a method. It stops being enough the moment the code leaves your machine.
public class PrintlnDemo {
    static void settle(int orderId) {
        System.out.println("settling " + orderId);
        System.out.println("done");
    }

    public static void main(String[] args) {
        settle(4711);
    }
}settling 4711
doneLook at what that output does not have. There is no timestamp, so you cannot tell whether done came a millisecond or an hour later. There is no thread name, so with two requests in flight the lines interleave and nothing tells you which is which. There is no source, so done could have come from any of the forty classes in the build. There is no level, so a routine progress note and a failure look identical to every tool that reads the file.
The two worst properties are the ones you notice last. You cannot turn it off: the only way to silence a println in production is to edit the source and redeploy. And you cannot route it: it goes to standard output and nowhere else, so java -cp out PrintlnDemo > /dev/null does not send it to a file — it destroys it. A logging framework exists to give you the six missing fields and the two missing controls.
SLF4J: an API with no implementation
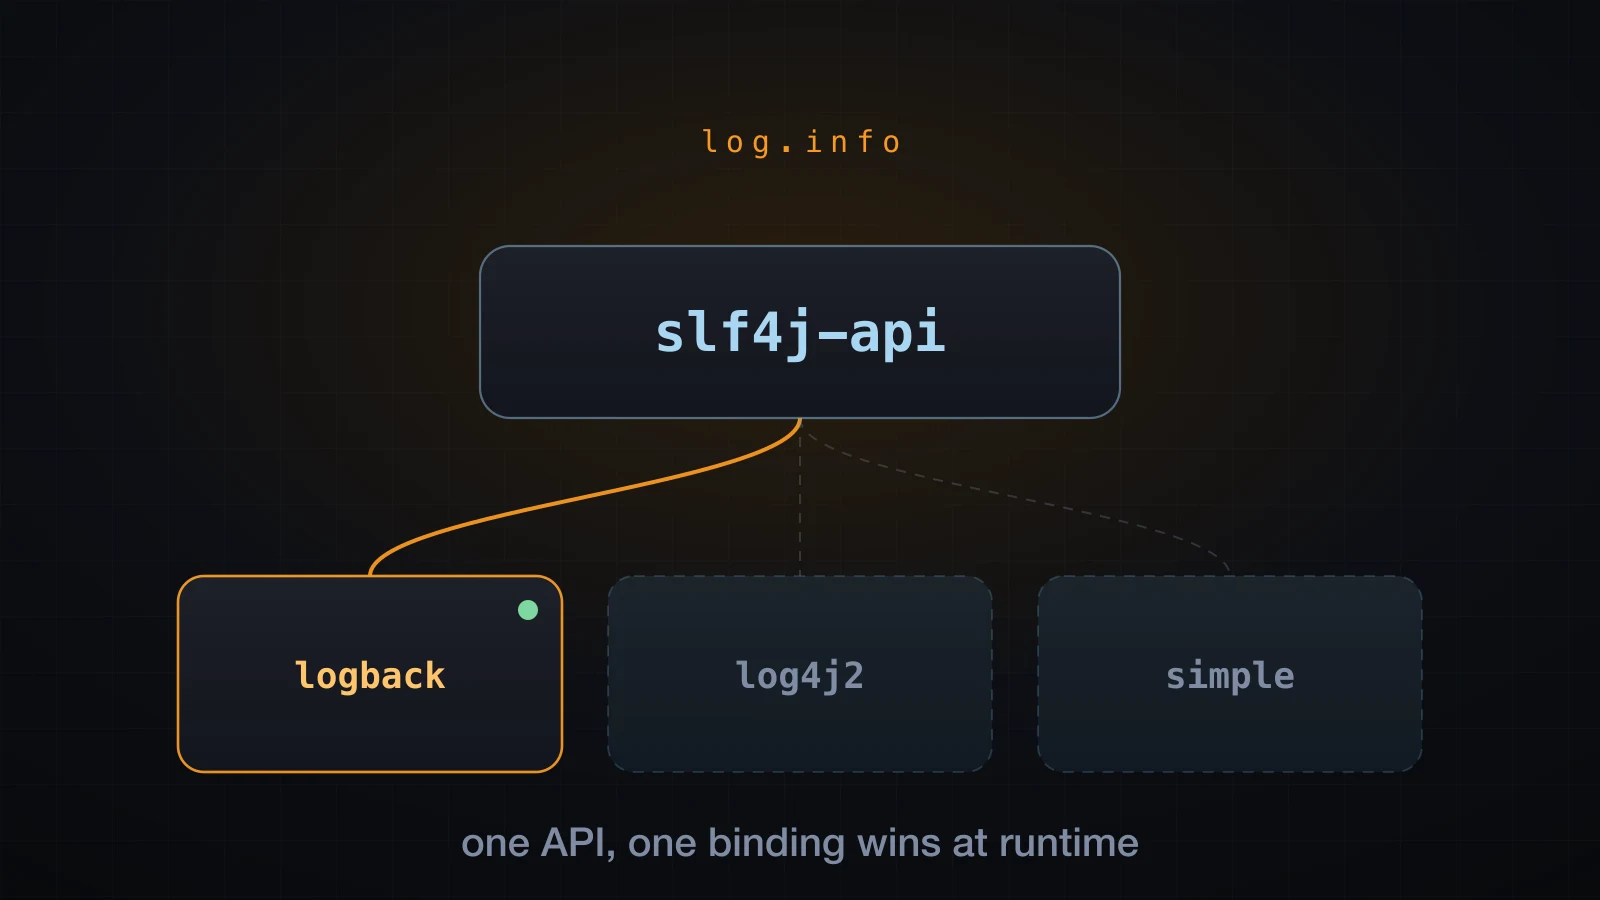
SLF4J (Simple Logging Facade for Java) is a facade. The slf4j-api jar contains the Logger interface and the LoggerFactory class and essentially nothing that can write a line anywhere. At startup, LoggerFactory uses the JDK's ServiceLoader to look for an implementation of org.slf4j.spi.SLF4JServiceProvider on the classpath. Whatever it finds is what your log.info call ends up doing.
That indirection is the whole point: a library can depend on slf4j-api alone, and the application that uses it decides at deploy time whether the output goes through Logback, Log4j 2 or nothing at all. It is also the single most confusing thing about Java logging, because the same source file behaves in three completely different ways depending on jars you never mention in the code.
import org.slf4j.Logger;
import org.slf4j.LoggerFactory;

public class FacadeDemo {
    private static final Logger log = LoggerFactory.getLogger(FacadeDemo.class);

    public static void main(String[] args) {
        System.out.println("logger class = " + log.getClass().getName());
        log.info("order {} accepted", 4711);
        log.warn("retrying payment for order {}", 4711);
    }
}
Compiling needs only the API:
javac -cp slf4j-api-2.0.13.jar -d out FacadeDemo.java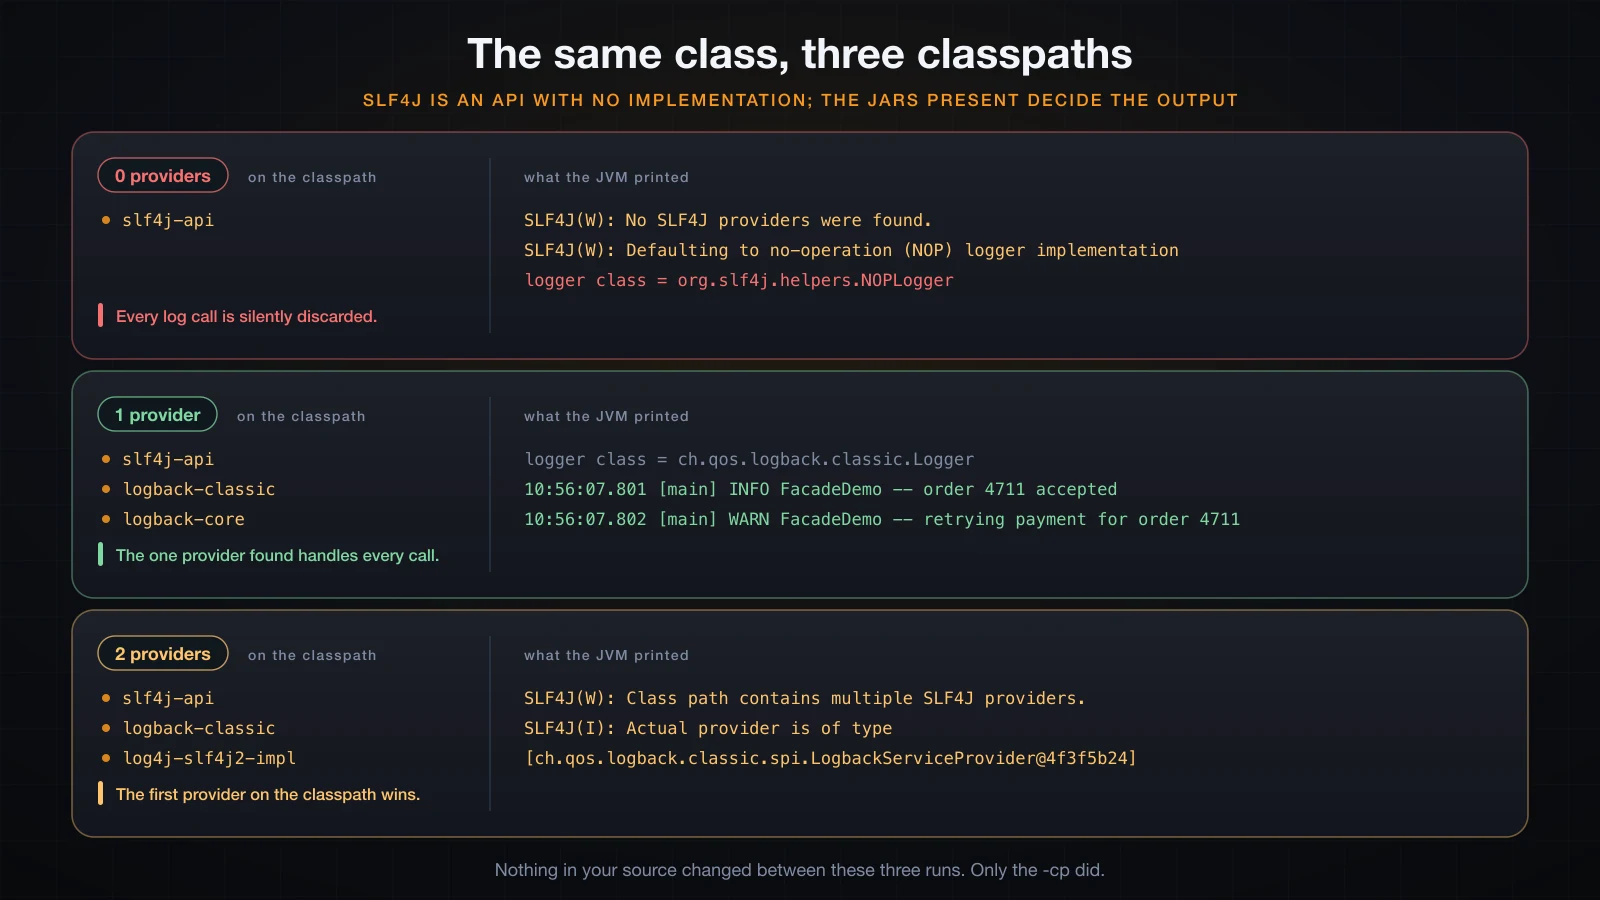
No binding: logging is silently a no-op
Run the compiled class with the API alone and nothing else:
java -cp out:slf4j-api-2.0.13.jar FacadeDemoSLF4J(W): No SLF4J providers were found.
SLF4J(W): Defaulting to no-operation (NOP) logger implementation
SLF4J(W): See https://www.slf4j.org/codes.html#noProviders for further details.
logger class = org.slf4j.helpers.NOPLoggerBoth log calls ran. Neither printed anything. NOPLogger implements every method of Logger as an empty body, so the program is correct, fast and completely silent. Those three SLF4J(W) lines are the only warning you get, they go to standard error, and in a container whose stderr nobody reads they are invisible. A service that appears to have "stopped logging" after a dependency change is very often this.
One binding: the provider decides the format
Add exactly one provider. slf4j-simple is the smallest one — a single jar, no configuration file, output on standard error:
java -cp out:slf4j-api-2.0.13.jar:slf4j-simple-2.0.13.jar FacadeDemologger class = org.slf4j.simple.SimpleLogger
[main] INFO FacadeDemo - order 4711 accepted
[main] WARN FacadeDemo - retrying payment for order 4711Swap it for Logback, which needs two jars — logback-classic is the provider, logback-core is the engine underneath it:
java -cp out:slf4j-api-2.0.13.jar:logback-classic-1.5.12.jar:logback-core-1.5.12.jar FacadeDemologger class = ch.qos.logback.classic.Logger
10:56:07.801 [main] INFO FacadeDemo -- order 4711 accepted
10:56:07.802 [main] WARN FacadeDemo -- retrying payment for order 4711Same class file, same bytecode, different concrete Logger and a different line format — including the -- separator in Logback's own built-in default pattern, where slf4j-simple uses a single -. Nothing in the source chose either one.
| Binding jar | Backend | Configured by | Typical use |
|---|---|---|---|
slf4j-simple | built in | system properties only | tests, tiny tools |
slf4j-nop | none | nothing | deliberately silencing a library |
logback-classic | Logback | logback.xml | the default for most applications |
log4j-slf4j2-impl | Log4j 2 | log4j2.xml | when you want Log4j 2 features |
jul-to-slf4j | routes into SLF4J | n/a | capturing java.util.logging output |
Two bindings: the first one found wins
Now put Logback and the Log4j 2 bridge on the classpath together, which is exactly what happens when two of your dependencies each drag in their own preference:
java -cp out:slf4j-api-2.0.13.jar:logback-classic-1.5.12.jar:logback-core-1.5.12.jar:\
log4j-slf4j2-impl-2.24.1.jar:log4j-api-2.24.1.jar:log4j-core-2.24.1.jar FacadeDemoSLF4J(W): Class path contains multiple SLF4J providers.
SLF4J(W): Found provider [ch.qos.logback.classic.spi.LogbackServiceProvider@4f3f5b24]
SLF4J(W): Found provider [org.apache.logging.slf4j.SLF4JServiceProvider@15aeb7ab]
SLF4J(W): See https://www.slf4j.org/codes.html#multiple_bindings for an explanation.
SLF4J(I): Actual provider is of type [ch.qos.logback.classic.spi.LogbackServiceProvider@4f3f5b24]
logger class = ch.qos.logback.classic.LoggerSLF4J does not fail. It picks one, tells you which, and carries on. Move the Log4j 2 jars ahead of the Logback jars on the same command line and the answer changes:
SLF4J(W): Class path contains multiple SLF4J providers.
SLF4J(W): Found provider [org.apache.logging.slf4j.SLF4JServiceProvider@4f3f5b24]
SLF4J(W): Found provider [ch.qos.logback.classic.spi.LogbackServiceProvider@15aeb7ab]
SLF4J(W): See https://www.slf4j.org/codes.html#multiple_bindings for an explanation.
SLF4J(I): Actual provider is of type [org.apache.logging.slf4j.SLF4JServiceProvider@4f3f5b24]
logger class = org.apache.logging.slf4j.Log4jLogger
Classpath order decides. That is why the symptom is so strange in practice: your logback.xml is suddenly ignored, no error appears, and the only clue is a warning on standard error. The fix is always to remove the binding you do not want rather than to fight over precedence — and keeping duplicate bindings out of a dependency tree is a build tool's job, which is where the next article picks up.
What are the log levels in Java, and how does the threshold work?
SLF4J defines five levels, ordered from least to most severe: trace, debug, info, warn, error. A logger has a threshold, and a call at a level below the threshold is discarded.
The key idea is that a level is a routing decision, not a severity opinion. You are not rating how upset you are about the event; you are declaring which audience it belongs to, so that a config file can decide later which audiences ship. error means a human has to do something. warn means the system recovered but paid for it. info means a milestone in normal operation. debug means detail you would want while reproducing a bug. trace means step-by-step noise you switch on for minutes at a time.
import org.slf4j.Logger;
import org.slf4j.LoggerFactory;

public class LevelsDemo {
    private static final Logger log = LoggerFactory.getLogger(LevelsDemo.class);

    public static void main(String[] args) {
        log.trace("entering settle() with {} arg(s)", args.length);
        log.debug("loaded 3 pending orders");
        log.info("settlement run started");
        log.warn("gateway slow, using cached rate");
        log.error("settlement failed for order {}", 4711, new IllegalStateException("no funds"));
        System.out.println("isDebugEnabled = " + log.isDebugEnabled());
    }
}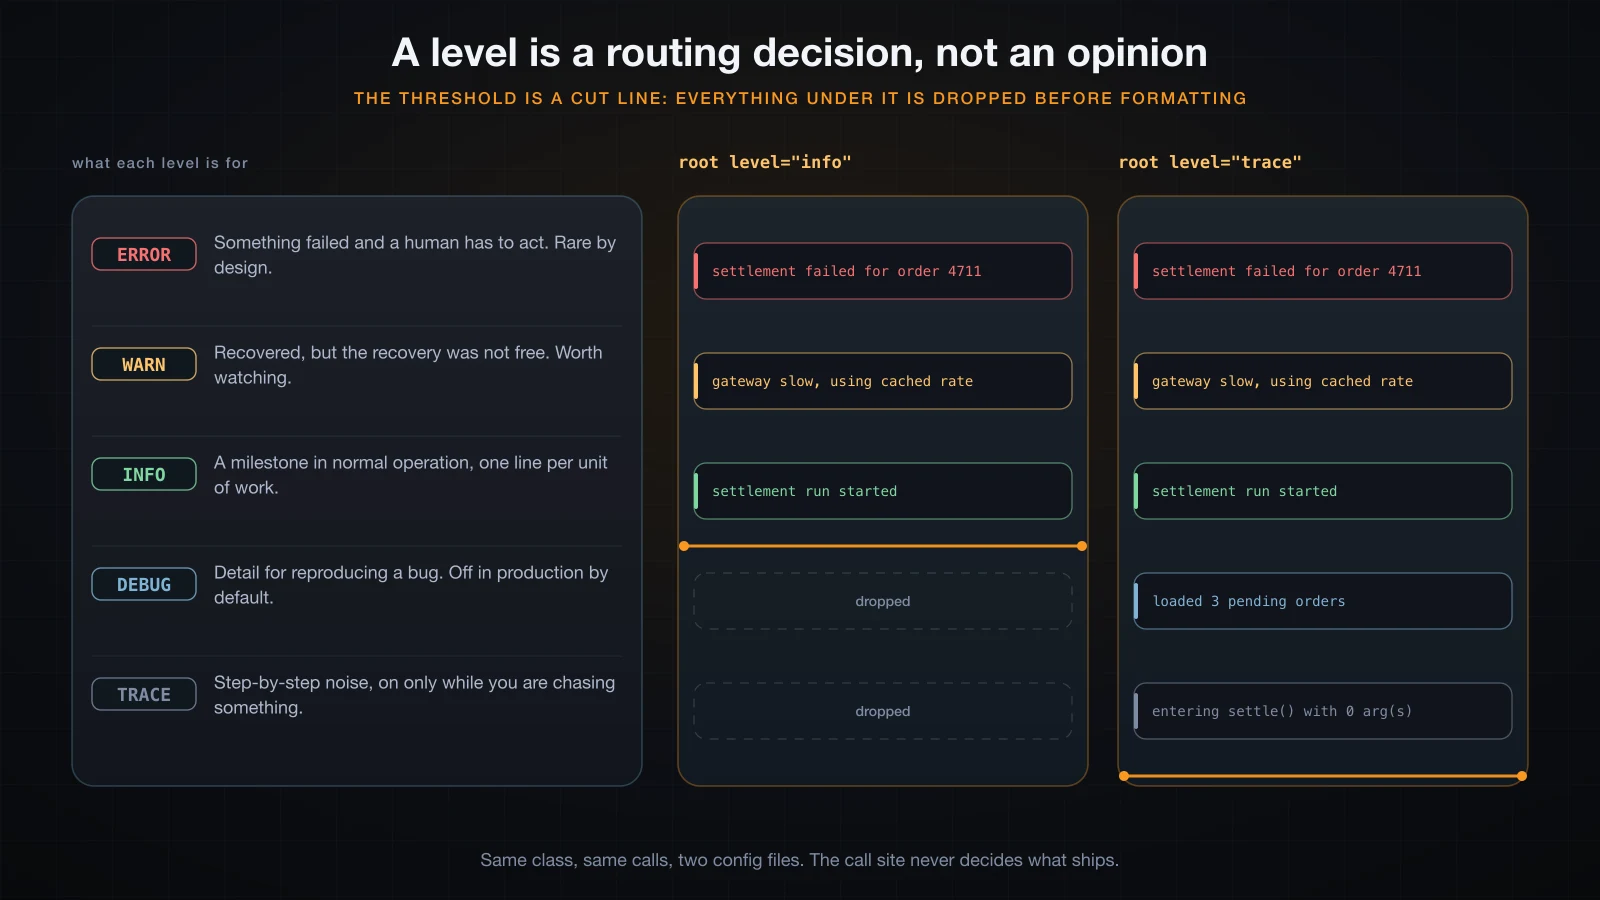
Run it with a Logback config whose root threshold is info:
java -cp out:slf4j-api-2.0.13.jar:logback-classic-1.5.12.jar:logback-core-1.5.12.jar \
-Dlogback.configurationFile=logback-info.xml LevelsDemo11:06:40.130 INFO LevelsDemo - settlement run started
11:06:40.131 WARN LevelsDemo - gateway slow, using cached rate
11:06:40.131 ERROR LevelsDemo - settlement failed for order 4711
java.lang.IllegalStateException: no funds
at LevelsDemo.main(LevelsDemo.java:12)
isDebugEnabled = falseChange one word in the config file to trace and run the identical class file again:
11:06:40.260 TRACE LevelsDemo - entering settle() with 0 arg(s)
11:06:40.260 DEBUG LevelsDemo - loaded 3 pending orders
11:06:40.260 INFO  LevelsDemo - settlement run started
11:06:40.260 WARN  LevelsDemo - gateway slow, using cached rate
11:06:40.260 ERROR LevelsDemo - settlement failed for order 4711
java.lang.IllegalStateException: no funds
	at LevelsDemo.main(LevelsDemo.java:12)
isDebugEnabled = true
isDebugEnabled flipping from false to true is the same threshold seen from inside the program. That method is how you ask the framework whether it is worth doing work for a log line, which matters in the next section.
Parameterised logging and why the placeholders exist
Every SLF4J method takes a message with {} placeholders and the values separately:
log.debug("user {} did {}", id, action);The usual explanation is "it is faster than string concatenation", which is true but describes the wrong thing. The real property is that with placeholders the arguments are not turned into strings at all unless the level is enabled. With concatenation the string is built by the caller, before the logger is even consulted, so the work happens whether or not anything will be printed.
That is easy to prove: give an object a toString() that counts how often it is called.
import org.slf4j.Logger;
import org.slf4j.LoggerFactory;

public class ParamDemo {
    private static final Logger log = LoggerFactory.getLogger(ParamDemo.class);

    static final class Cart {
        static int toStringCalls = 0;
        private final int items;
        Cart(int items) { this.items = items; }
        @Override public String toString() {
            toStringCalls++;
            return "Cart[items=" + items + "]";
        }
    }

    public static void main(String[] args) {
        Cart cart = new Cart(3);

        for (int i = 0; i < 1000; i++) {
            log.debug("cart state: " + cart);
        }
        System.out.println("after 1000 concatenated calls, toString() ran " + Cart.toStringCalls + " times");

        Cart.toStringCalls = 0;

        for (int i = 0; i < 1000; i++) {
            log.debug("cart state: {}", cart);
        }
        System.out.println("after 1000 parameterised calls, toString() ran " + Cart.toStringCalls + " times");

        System.out.println("isDebugEnabled = " + log.isDebugEnabled());
    }
}
With the root threshold at info, so that every one of those 2000 debug calls is discarded:
after 1000 concatenated calls, toString() ran 1000 times
after 1000 parameterised calls, toString() ran 0 times
isDebugEnabled = false
A thousand toString() calls, a thousand StringBuilder allocations and a thousand throwaway String objects, all for output that was never written. The placeholder version did none of it. That is the concrete reason for the {} syntax, and it is a property of whether the work happens, not of how quickly the formatting runs.
There is a limit worth knowing. Placeholders defer toString(), but they cannot defer the evaluation of the argument expression itself — that happens before the call, like every Java argument:
import org.slf4j.Logger;
import org.slf4j.LoggerFactory;

public class DeferDemo {
    private static final Logger log = LoggerFactory.getLogger(DeferDemo.class);
    static int scans = 0;

    static String expensiveSummary() {
        scans++;
        return "summary";
    }

    public static void main(String[] args) {
        log.debug("cache summary: {}", expensiveSummary());
        System.out.println("plain placeholder call -> scans = " + scans);

        scans = 0;
        log.atDebug().addArgument(() -> expensiveSummary()).log("cache summary: {}");
        System.out.println("fluent supplier call  -> scans = " + scans);

        scans = 0;
        if (log.isDebugEnabled()) {
            log.debug("cache summary: {}", expensiveSummary());
        }
        System.out.println("guarded call          -> scans = " + scans);
    }
}plain placeholder call -> scans = 1
fluent supplier call -> scans = 0
guarded call -> scans = 0So the rule is: use {} always; add an isDebugEnabled() guard, or the SLF4J 2 fluent addArgument(Supplier) form, only when producing the argument is itself expensive.
Configuring Logback and Log4j 2
Configuration is where the two implementations differ, and it is the only place they differ for most applications. Both are read from the classpath by default — logback.xml and log4j2.xml — and both can be pointed at an explicit file with a system property, which is how every example here was run.
A minimal logback.xml
<configuration>
  <appender name="STDOUT" class="ch.qos.logback.core.ConsoleAppender">
    <encoder>
      <pattern>%d{HH:mm:ss.SSS} %-5level %logger{20} - %msg%n</pattern>
    </encoder>
  </appender>
  <root level="info">
    <appender-ref ref="STDOUT"/>
  </root>
</configuration>
Three concepts, and they are the same three in every framework. An appender is a destination — a console, a file, a socket. A layout or encoder turns an event into text; the pattern string is a small language where %d is the timestamp, %-5level is the level left-padded to five characters, %logger{20} is the logger name abbreviated to twenty characters, %msg is the formatted message and %n is the platform line separator. A logger has a level and a set of appenders, and root is the one every other logger inherits from.
A minimal log4j2.xml
<?xml version="1.0" encoding="UTF-8"?>
<Configuration status="WARN">
  <Appenders>
    <Console name="Console" target="SYSTEM_OUT">
      <PatternLayout pattern="%d{HH:mm:ss.SSS} %-5level %logger{36} - %msg%n"/>
    </Console>
  </Appenders>
  <Loggers>
    <Logger name="com.example.repo" level="debug"/>
    <Root level="info">
      <AppenderRef ref="Console"/>
    </Root>
  </Loggers>
</Configuration>
Different element names, identical model — and, usefully, an almost identical pattern language. The status="WARN" attribute controls Log4j 2's own internal diagnostics, which is the first thing to turn up when a config file is being ignored.
Per-package levels
The Logger element above is the feature you will use most: a level set on a logger name applies to that name and everything under it. Since the conventional logger name is the fully qualified class name, a logger name is a package prefix, and you can turn on debug for one package without drowning in everyone else's.
import org.slf4j.Logger;
import org.slf4j.LoggerFactory;

public class PackageLevelDemo {
    private static final Logger app  = LoggerFactory.getLogger("com.example.web.OrderController");
    private static final Logger repo = LoggerFactory.getLogger("com.example.repo.OrderRepository");

    public static void main(String[] args) {
        app.debug("controller debug line");
        app.info("controller info line");
        repo.debug("select * from orders where id = {}", 4711);
        repo.info("repository info line");
    }
}
Run it against the Log4j 2 config above:
10:57:42.124 INFO  com.example.web.OrderController - controller info line
10:57:42.127 DEBUG com.example.repo.OrderRepository - select * from orders where id = 4711
10:57:42.127 INFO  com.example.repo.OrderRepository - repository info line
The controller's debug line is gone because com.example.web inherits the root threshold of info; the repository's survives because com.example.repo was raised to debug. The equivalent Logback fragment is one line and produced byte-identical output apart from the timestamp:
<logger name="com.example.repo" level="debug"/>Rolling files, honestly
A ConsoleAppender is right for a containerised service whose output is collected by the platform. When you do write files, the appender you want is a rolling one, so that the file is capped and old files are removed rather than filling a disk at three in the morning.
<configuration>
  <appender name="FILE" class="ch.qos.logback.core.rolling.RollingFileAppender">
    <file>logs/app.log</file>
    <rollingPolicy class="ch.qos.logback.core.rolling.SizeAndTimeBasedRollingPolicy">
      <fileNamePattern>logs/app.%d{yyyy-MM-dd}.%i.log.gz</fileNamePattern>
      <maxFileSize>2KB</maxFileSize>
      <maxHistory>7</maxHistory>
      <totalSizeCap>20KB</totalSizeCap>
    </rollingPolicy>
    <encoder>
      <pattern>%d{HH:mm:ss.SSS} %-5level %logger{20} - %msg%n</pattern>
    </encoder>
  </appender>
  <root level="info">
    <appender-ref ref="FILE"/>
  </root>
</configuration>
The sizes here are deliberately absurd — 2KB per file, 20KB in total — so that the rollover happens after a hundred lines instead of after a gigabyte. Logging 120 lines against it produced:
app.2026-09-10.0.log.gz
app.2026-09-10.1.log.gz
app.log
Three files: the live one and two rotated archives, gzipped because the fileNamePattern ends in .gz. In production you would write maxFileSize as 100MB and totalSizeCap as 3GB; the mechanism is exactly the one shown. Two caveats worth stating plainly: maxHistory counts periods (days here), not files, and totalSizeCap is enforced on rollover, so a single file can exceed it between rollovers.
Structured logging and MDC
A log line has two audiences. A human reads a handful of them during an incident; a machine reads millions of them in a search index. Prose serves the first and fails the second.
import org.slf4j.Logger;
import org.slf4j.LoggerFactory;

public class StructuredDemo {
    private static final Logger log = LoggerFactory.getLogger(StructuredDemo.class);

    public static void main(String[] args) {
        log.info("The order for customer 812 was rejected because the card expired");

        log.atInfo()
           .addKeyValue("orderId", 4711)
           .addKeyValue("customerId", 812)
           .addKeyValue("reason", "card_expired")
           .log("order rejected");
    }
}
With a Logback pattern ending in %msg %kvp%n, which renders the key-value pairs SLF4J 2's fluent API attaches:
10:57:57.490 INFO  StructuredDemo - The order for customer 812 was rejected because the card expired
10:57:57.491 INFO  StructuredDemo - order rejected orderId="4711" customerId="812" reason="card_expired"
The first line can only be found by guessing the wording someone used. The second has a stable message you can count and stable keys you can filter and group by, and it survives the day someone rewrites the sentence. You do not need a JSON layout to get most of this benefit — a fixed message plus key="value" pairs is already grep-friendly and index-friendly.
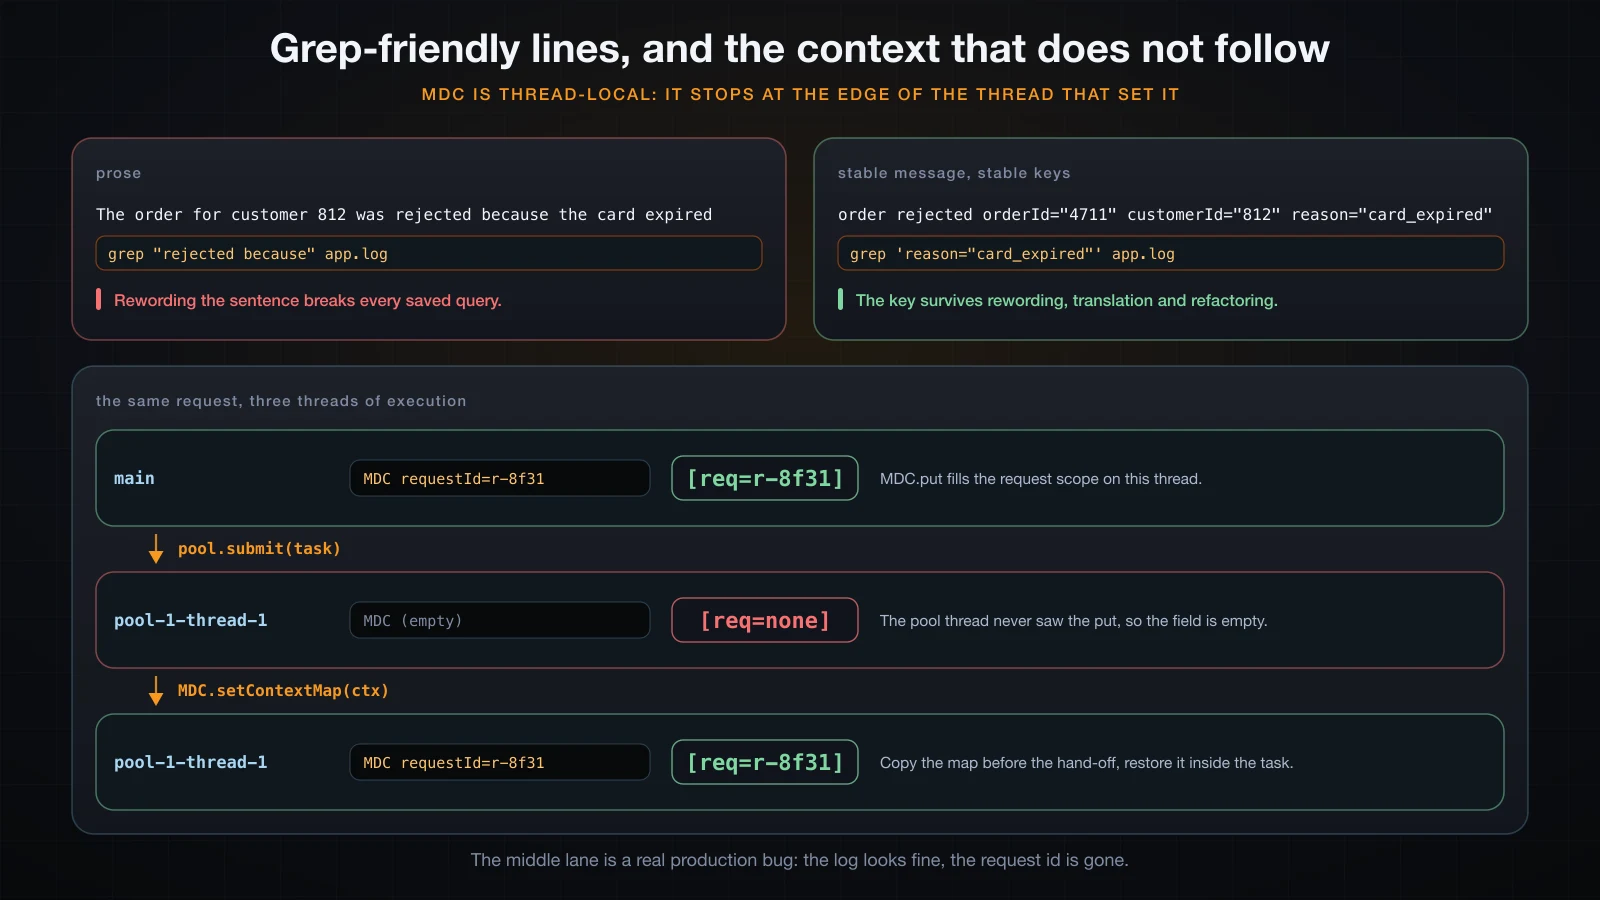
The other half of structured logging is context you do not want to pass as a parameter to every method. MDC (Mapped Diagnostic Context) is a map attached to the current thread; a pattern can print any key from it, so a request id set once appears on every subsequent line.
import java.util.Map;
import java.util.concurrent.ExecutorService;
import java.util.concurrent.Executors;
import java.util.concurrent.TimeUnit;
import org.slf4j.Logger;
import org.slf4j.LoggerFactory;
import org.slf4j.MDC;

public class MdcDemo {
    private static final Logger log = LoggerFactory.getLogger(MdcDemo.class);

    public static void main(String[] args) throws Exception {
        ExecutorService pool = Executors.newFixedThreadPool(1);
        pool.submit(() -> log.info("pool thread warmed up")).get();

        MDC.put("requestId", "r-8f31");
        log.info("handling POST /orders");
        log.info("validated payload");

        pool.submit(() -> log.info("charging the card on a pool thread")).get();

        Map<String, String> ctx = MDC.getCopyOfContextMap();
        pool.submit(() -> {
            MDC.setContextMap(ctx);
            try {
                log.info("charging the card, context carried across");
            } finally {
                MDC.clear();
            }
        }).get();

        log.info("responded 201");
        MDC.clear();
        log.info("outside the request scope");

        pool.shutdown();
        pool.awaitTermination(5, TimeUnit.SECONDS);
    }
}
The pattern reads the key with %X, and :-none supplies a default when the key is absent:
<pattern>%d{HH:mm:ss.SSS} %-5level [%thread] [req=%X{requestId:-none}] %logger{20} - %msg%n</pattern>10:57:13.553 INFO [pool-1-thread-1] [req=none] MdcDemo - pool thread warmed up
10:57:13.555 INFO [main] [req=r-8f31] MdcDemo - handling POST /orders
10:57:13.555 INFO [main] [req=r-8f31] MdcDemo - validated payload
10:57:13.555 INFO [pool-1-thread-1] [req=none] MdcDemo - charging the card on a pool thread
10:57:13.556 INFO [pool-1-thread-1] [req=r-8f31] MdcDemo - charging the card, context carried across
10:57:13.556 INFO [main] [req=r-8f31] MdcDemo - responded 201
10:57:13.556 INFO [main] [req=none] MdcDemo - outside the request scopeLine four is the bug. The task was submitted while requestId was set, but MDC is thread-local, so the pool thread that ran it has its own empty map and the field printed none. Nothing failed, nothing warned — the request id simply stopped appearing halfway through the request, which is a miserable thing to discover during an incident. Line five is the fix: capture the map with MDC.getCopyOfContextMap() on the calling thread, call MDC.setContextMap inside the task, and clear it in a finally so the pooled thread does not carry the value into an unrelated task later.
The finally is not optional. A pool thread is reused; a value left in its MDC will be printed on somebody else's request. The same argument applies to the last line of main — always clear the scope you set.
How do you log an exception without losing the stack trace?
Every SLF4J method has an overload whose last argument is a Throwable. If you pass the exception there, the framework prints the trace. If you concatenate e.getMessage() into the text instead, you keep one sentence and throw away everything that says where the failure came from.
import org.slf4j.Logger;
import org.slf4j.LoggerFactory;

public class ExceptionLogDemo {
    private static final Logger log = LoggerFactory.getLogger(ExceptionLogDemo.class);

    static int parseQuantity(String raw) {
        return Integer.parseInt(raw);
    }

    static void loadOrder(String raw) {
        try {
            parseQuantity(raw);
        } catch (NumberFormatException e) {
            throw new IllegalStateException("order 4711 has a broken quantity", e);
        }
    }

    public static void main(String[] args) {
        try {
            loadOrder("12x");
        } catch (Exception e) {
            log.error("could not load order: " + e.getMessage());   // loses the trace
            log.error("could not load order {}", 4711, e);          // keeps the trace
        }
    }
}10:57:25.893 ERROR ExceptionLogDemo - could not load order: order 4711 has a broken quantity
10:57:25.894 ERROR ExceptionLogDemo - could not load order 4711
java.lang.IllegalStateException: order 4711 has a broken quantity
at ExceptionLogDemo.loadOrder(ExceptionLogDemo.java:15)
at ExceptionLogDemo.main(ExceptionLogDemo.java:21)
Caused by: java.lang.NumberFormatException: For input string: "12x"
at java.base/java.lang.NumberFormatException.forInputString(NumberFormatException.java:67)
at java.base/java.lang.Integer.parseInt(Integer.java:662)
at java.base/java.lang.Integer.parseInt(Integer.java:778)
at ExceptionLogDemo.parseQuantity(ExceptionLogDemo.java:8)
at ExceptionLogDemo.loadOrder(ExceptionLogDemo.java:13)
... 1 common frames omittedThe first line tells you an order was broken. The second tells you it was broken at ExceptionLogDemo.java:15, because parseQuantity was handed the string "12x" at line 13, and the original NumberFormatException came from Integer.parseInt. One of those lines can be acted on; the other cannot.
Two details in that output are worth naming. The throwable argument is not consumed by a {} placeholder — log.error("could not load order {}", 4711, e) has two arguments for one placeholder, and SLF4J treats a trailing Throwable specially. And ... 1 common frames omitted is not truncation: it means the remaining frames of the cause are identical to the frames already printed above it.
java.util.logging and Log4j 1
java.util.logging (JUL) has shipped in the JDK since Java 1.4 and needs no dependency at all. It is also rarely chosen, and the default output shows why:
import java.util.logging.Level;
import java.util.logging.Logger;

public class JulDemo {
    private static final Logger log = Logger.getLogger(JulDemo.class.getName());

    public static void main(String[] args) {
        log.info("settlement run started");
        log.fine("this is JUL's debug level and is off by default");
        log.log(Level.SEVERE, "settlement failed", new IllegalStateException("no funds"));
    }
}Sep 10, 2026 10:59:23 AM JulDemo main
INFO: settlement run started
Sep 10, 2026 10:59:23 AM JulDemo main
SEVERE: settlement failed
java.lang.IllegalStateException: no funds
at JulDemo.main(JulDemo.java:10)Two lines per record by default, a non-obvious level vocabulary (SEVERE, WARNING, INFO, CONFIG, FINE, FINER, FINEST), configuration through a properties file plus system properties, and no parameterised call that defers formatting the way {} does. It is entirely usable, and if you are writing a small library with a hard zero-dependency rule it is the honest choice. Otherwise, jul-to-slf4j exists precisely so that JUL output from a dependency can be routed into the same pipeline as everything else.
Log4j 1.x is a different case: it reached end of life in August 2015 and has not received fixes since. It is not a style preference — an unmaintained logging framework is a dependency nobody is patching. If you meet it, the migration target is Log4j 2 (which is a rewrite, not an upgrade) or Logback via SLF4J, and log4j-1.2-api exists as a bridge so that old call sites keep compiling while the backend changes underneath them. Log4j 2's own history is the reason to care about version currency here: the Log4Shell vulnerability disclosed in December 2021 (CVE-2021-44228) affected log4j-core across a wide range of 2.x releases; the first fix shipped in 2.15.0 and the follow-up issues were closed out through 2.17.1, and it is the reason a logging library deserves the same dependency hygiene as anything that touches untrusted input. Use a current release — this article used 2.24.1 — and let the build tool tell you when one of your dependencies pins an old one.
Debugging a Java program beyond the log
Logging tells you what a program decided to write down. Debugging is what you do when the interesting state was never written down at all.
Reading a stack trace
A stack trace is printed innermost frame first: the top line is where the exception was constructed, and each line below is the caller of the one above. The instinct is to read the top line and stop, which is usually the wrong frame — the top of a NullPointerException is frequently deep inside the JDK or a framework.
public class BugDemo {
    static int total(int[] prices) {
        int sum = 0;
        for (int i = 0; i <= prices.length; i++) {
            sum += prices[i];
        }
        return sum;
    }

    public static void main(String[] args) {
        System.out.println(total(new int[] { 300, 250, 175 }));
    }
}Exception in thread "main" java.lang.ArrayIndexOutOfBoundsException: Index 3 out of bounds for length 3
at BugDemo.total(BugDemo.java:5)
at BugDemo.main(BugDemo.java:11)Read it in this order. The exception type and message first: Index 3 out of bounds for length 3 already tells you the loop ran one iteration too many, before you look at a single frame. Then find the topmost frame in code you own — here BugDemo.total(BugDemo.java:5) — because that is the line you can change. Then read downwards for the values: BugDemo.main(BugDemo.java:11) is where the array was built, which is how you learn what the input was. In the ExceptionLogDemo output earlier the same reading order applies, with the extra rule that Caused by: sections are printed outermost-first, so the last Caused by: block holds the original failure.
Breakpoints without an IDE: jdb
An IDE breakpoint is the fastest tool here and you should use it. But jdb ships with the JDK, works over a terminal on a remote box, and makes it obvious what a breakpoint actually is. Compile with -g so local variable names survive, then drive it with commands:
javac -g -d out BugDemo.java
jdb -classpath out BugDemo> stop at BugDemo:5
Deferring breakpoint BugDemo:5.
It will be set after the class is loaded.
> run
Set deferred breakpoint BugDemo:5
Breakpoint hit: "thread=main", BugDemo.total(), line=5 bci=10
main[1] where
[1] BugDemo.total (BugDemo.java:5)
[2] BugDemo.main (BugDemo.java:11)
main[1] locals
Method arguments:
prices = instance of int[3] (id=450)
Local variables:
sum = 0
i = 0Three cont commands later, the fourth hit shows the state that proves the bug:
main[1] locals
Method arguments:
prices = instance of int[3] (id=450)
Local variables:
sum = 725
i = 3
main[1] cont
Exception occurred: java.lang.ArrayIndexOutOfBoundsException (uncaught)"thread=main", BugDemo.total(), line=5 bci=13
sum = 725 is the correct total and i = 3 is one past the end — the loop condition should have been i < prices.length. The useful jdb vocabulary is small: stop at Class:line and stop in Class.method set breakpoints, run, cont and step move, locals, print expr and dump obj inspect, where prints the stack, and watch Class.field stops on every write to a field.
Two concepts are worth knowing by name even if you set them in an IDE. A conditional breakpoint only suspends when an expression is true, which is how you catch the one iteration in fifty thousand that misbehaves without stepping through the other 49,999. A watchpoint — jdb's watch — suspends on access to or modification of a field rather than at a line, which is the tool for "this value is wrong and I have no idea who wrote it".
Inspecting a live JVM: jcmd, jstack and jmap
None of that helps with a process that is already running in production and cannot be restarted. For that, the JDK ships tools that attach to a live JVM by pid. Find the pid with jps -l, then:
jcmd <pid> help          # every diagnostic command this JVM supports
jstack <pid>             # a full thread dump
jmap -histo:live <pid>   # a live-object histogram by class
jcmd <pid> help is the entry point: on OpenJDK 21 it lists Thread.print, GC.class_histogram, GC.heap_info, GC.heap_dump, VM.flags, VM.system_properties, JFR.start and about thirty more. jstack and jmap -histo are convenience front ends for two of them.
A thread dump answers "what is every thread doing right now". Each entry names the thread, gives its state, and prints its stack:
"order-poller" #20 [28163] daemon prio=5 os_prio=31 ... waiting on condition
   java.lang.Thread.State: TIMED_WAITING (sleeping)
	at java.lang.Thread.sleep0(java.base@21.0.6/Native Method)
	at java.lang.Thread.sleep(java.base@21.0.6/Thread.java:509)
	at LiveApp.lambda$main$0(LiveApp.java:11)
	at LiveApp$$Lambda/0x00000078010009f8.run(Unknown Source)
	at java.lang.Thread.runWith(java.base@21.0.6/Thread.java:1596)
(The cpu= and elapsed= counters in the header line are elided above; they are per-thread accounting, not a benchmark.) An earlier article in this course used thread dumps to diagnose a deadlock, so it is enough to say here that a dump is also how you answer far more ordinary questions: which threads exist, whether a pool is saturated, and whether the thread you think is doing work is actually parked. Take two dumps a few seconds apart — a thread stuck at the same frame in both is a very different problem from one that moved.
jmap -histo:live answers "what is filling the heap". It runs a full GC first, so only reachable objects are counted:
 num     #instances         #bytes  class name (module)
-------------------------------------------------------
   1:        207829        6745768  [B (java.base@21.0.6)
   2:        207748        4985952  java.lang.String (java.base@21.0.6)
   3:          1047        1089288  [Ljava.lang.Object; (java.base@21.0.6)
   4:          1507         186312  java.lang.Class (java.base@21.0.6)
   5:          1335          44096  [I (java.base@21.0.6)
That is a process holding a list of 200,000 strings, and the histogram shows it exactly: 207,748 String instances and a matching 207,829 byte[] ([B), because since Java 9 a String stores its characters in a byte[]. A histogram will not tell you who is holding them — for that you need a heap dump via jcmd <pid> GC.heap_dump and a heap analyser — but it narrows a leak to a type in one command, and the -histo:live variant costs a full GC, so use it deliberately on a busy service.
Which jar did that class come from? -verbose:class
-verbose:class makes the JVM print every class it loads and the file it came from. It is noisy — a bare hello-world program loads 447 classes on OpenJDK 21.0.6 — but piped through grep it answers questions nothing else answers cleanly, including the binding puzzle from the start of this article:
java -verbose:class -cp out:slf4j-api-2.0.13.jar:logback-classic-1.5.12.jar:\
logback-core-1.5.12.jar:log4j-slf4j2-impl-2.24.1.jar:log4j-api-2.24.1.jar:\
log4j-core-2.24.1.jar FacadeDemo 2>&1 | grep ServiceProvider[0.021s][info][class,load] org.slf4j.spi.SLF4JServiceProvider source: jars/slf4j-api-2.0.13.jar
[0.021s][info][class,load] org.slf4j.helpers.SubstituteServiceProvider source: jars/slf4j-api-2.0.13.jar
[0.023s][info][class,load] org.slf4j.helpers.NOP_FallbackServiceProvider source: jars/slf4j-api-2.0.13.jar
[0.031s][info][class,load] ch.qos.logback.classic.spi.LogbackServiceProvider source: jars/logback-classic-1.5.12.jar
[0.033s][info][class,load] org.apache.logging.slf4j.SLF4JServiceProvider source: jars/log4j-slf4j2-impl-2.24.1.jarEvery provider on the classpath, and the exact jar each one came from. The same trick identifies which of two jars supplied a duplicated class when a NoSuchMethodError appears at runtime — the class loaded fine, it just came from the wrong copy.
What not to log
A log file is copied to a search index, replicated across nodes, backed up, and read by people who were never granted access to production data. Everything in it should survive that journey.
Never log credentials or secrets: passwords, API keys, bearer tokens, session ids, private keys. Never log full request or response bodies on a path that carries them, because "log the payload for debugging" is how a password ends up in an index that a hundred people can search. Never log personal data you would not be comfortable exporting — full names, addresses, national identifiers, card numbers — and remember that an id plus a timestamp is usually enough to correlate.
The trap is that you rarely log a secret on purpose. You log an object, and its toString() does it for you:
record LoginRequest(String email, String password) {}

record SafeLoginRequest(String email, String password) {
    @Override public String toString() {
        return "SafeLoginRequest[email=" + email + ", password=***]";
    }
}10:59:59.149 INFO SecretsDemo - login attempt: LoginRequest[email=a@example.com, password=hunter2]
10:59:59.155 INFO SecretsDemo - login attempt: SafeLoginRequest[email=a@example.com, password=***]A record's generated toString() prints every component, so the plain version leaked the password into the log with a call that looked entirely innocent. Override toString() on any type that carries a secret, log identifiers rather than objects on sensitive paths, and treat "what does this object print" as part of the type's public contract.
⚠️ Logging is often the widest data-export path in a system, and it is the one nobody reviews. A single
log.debugon a request body can defeat every access control in front of the database.
FAQ
What is the difference between SLF4J, Logback and Log4j 2?
SLF4J is an API and nothing else — the Logger interface your code calls, with no ability to write a line anywhere. Logback and Log4j 2 are implementations that do the writing, and each has its own configuration file and feature set. Your code depends on slf4j-api; your application adds exactly one binding jar (logback-classic, or log4j-slf4j2-impl for Log4j 2) to decide which implementation runs. Logback was written by the author of SLF4J and is the common default; Log4j 2 is a separate Apache project with a rewritten core. Both were driven by the same pattern strings in the examples above and produced output that differed only in the timestamp.
Why does my application print no logs at all?
The most likely cause is that no SLF4J provider is on the classpath. Look on standard error for SLF4J(W): No SLF4J providers were found. — with no provider, LoggerFactory returns a NOPLogger whose methods do nothing, so every call succeeds silently. The second most likely cause is a threshold: a root level="warn" config discards every info and debug call. The third is a configuration file that is not being read, which Logback will tell you about if you add <configuration debug="true"> and Log4j 2 will tell you about through its status attribute.
Should I use log.debug with string concatenation or placeholders?
Placeholders, always. With concatenation the message is built by the caller before the logger is consulted, so the work happens even when the level is disabled — the counter in this article recorded 1000 toString() calls for 1000 discarded debug statements, against 0 for the placeholder version. Placeholders do not defer evaluation of the argument expression itself, so if producing the argument is expensive, wrap the call in if (log.isDebugEnabled()) or use the SLF4J 2 fluent form log.atDebug().addArgument(() -> expensive()).log("..."), which took the count to 0 as well.
How do I keep an MDC value across a thread pool?
Capture and restore it explicitly. MDC is backed by a thread-local map, so a task submitted to an executor runs on a thread that has its own, usually empty, context — in the run above the pool thread printed [req=none] while the caller printed [req=r-8f31]. Take a snapshot on the calling thread with MDC.getCopyOfContextMap(), call MDC.setContextMap(snapshot) as the first statement of the task, and MDC.clear() in a finally block so the pooled thread does not carry the value into an unrelated task. Wrapping the executor once, so every submitted task does this, is better than remembering at each call site.
What is the right way to log an exception in Java?
Pass the throwable as the last argument: log.error("could not load order {}", orderId, e). SLF4J treats a trailing Throwable specially, so it does not need a {} placeholder, and the binding prints the full trace including every Caused by: section. Concatenating e.getMessage() into the message keeps one sentence and discards the frames, which is the difference between knowing an order was broken and knowing it broke at line 15 because parseQuantity was handed "12x". Do not log and rethrow the same exception — you will get the same trace twice from two different places.
How do I inspect a Java process that is already running?
By pid, with the tools in the JDK. jps -l lists the running JVMs; jcmd <pid> help lists every diagnostic command that JVM supports; jstack <pid> (or jcmd <pid> Thread.print) dumps every thread with its state and stack; jmap -histo:live <pid> prints a per-class histogram of reachable objects, which narrows a memory problem to a type in one command; and jcmd <pid> GC.heap_dump writes a full heap dump for offline analysis. None of these require the process to have been started with special flags, and -histo:live forces a full GC, so treat it as an intrusive operation on a busy service.
Is Log4j still safe to use after Log4Shell?
Current Log4j 2 releases are actively maintained and are a normal choice; the examples here used 2.24.1. Log4Shell (CVE-2021-44228, December 2021) affected log4j-core across a range of 2.x versions, was first fixed in 2.15.0 and fully closed out by 2.17.1, so what it argues for is version currency rather than avoiding the project. Log4j 1.x is a different matter: it reached end of life in 2015 and receives no fixes at all, so it should be migrated off rather than pinned. The practical control is a build tool that reports which version of log4j-core actually resolves in your dependency tree, since a transitive dependency can pin an old one without your knowledge.
Conclusion
The one idea that makes Java logging make sense is that slf4j-api is an interface and nothing more. Everything strange about it follows from that: with no binding your log calls compile, run and print nothing; with one binding the jar chooses your format; with two, the first on the classpath silently wins and your config file is ignored. Once that is clear, the rest is a short list of habits — use {} placeholders so discarded calls cost nothing, pass the throwable as the last argument so traces survive, set levels per package rather than globally, put stable keys in the line instead of prose, restore MDC by hand across a thread hand-off, and never let an object's toString() decide what leaves your system.
The debugging half is the same discipline pointed at a process instead of a file. Read a stack trace by its message and the topmost frame you own rather than by its deepest frame. Reach for a conditional breakpoint when the failure is one iteration in fifty thousand, and for a watchpoint when a field is wrong and nobody will admit to writing it. And remember that a JVM in production is not a black box: jps, jcmd, jstack, jmap and -verbose:class will tell you what every thread is doing, what is filling the heap and which jar a class really came from, without restarting anything.
Every one of these examples was run by putting jars on a classpath by hand, which is exactly the job you should never do twice. The next article covers Maven and Gradle: declaring dependencies, resolving the version conflicts that produce duplicate SLF4J bindings in the first place, and building a project that assembles its own classpath.
![[Advanced Java] Unit Testing in Java with JUnit 5](/images/blog/junit5-thumbnail.en.webp)
![[Advanced Java] Connection Pooling in Java with HikariCP](/images/blog/hikaricp-thumbnail.en.webp)
![[Advanced Java] Building a REST API with Spring Boot](/images/blog/rest-api-thumbnail.en.webp)
![[Advanced Java] Deadlock and Livelock in Java: Diagnosing and Preventing Them](/images/blog/deadlock-thumbnail.en.webp)