In the world of modern web development, performance is everything. A smooth, responsive React app delivers a great user experience, while laggy, slow apps can drive users away for good. To help developers "diagnose" and optimize app performance, React DevTools comes equipped with a powerful tool: the Profiler.

This article will take you from beginner to expert in using the Profiler, making it easy to identify and fix performance bottlenecks in your React apps.
What is the React Profiler? Why Should You Care?
The React Profiler is a tool built into React DevTools that lets you record and analyze rendering performance of your app’s components. It helps answer key questions like:
- Which components are re-rendering unnecessarily?
- How long does it take to render a specific component?
- What triggered a render?
- Are optimizations like
memoactually effective?
By providing these insights, the Profiler helps you make precise optimization decisions instead of guessing.
Getting Started: Recording Your First Profiling Session
First, install the React Developer Tools extension for your browser (available for Chrome, Firefox, and Edge). After installing, open Developer Tools (usually with F12) and you’ll see two new tabs: ⚛️ Components and ⚛️ Profiler.
Follow these steps to record a profiling session:
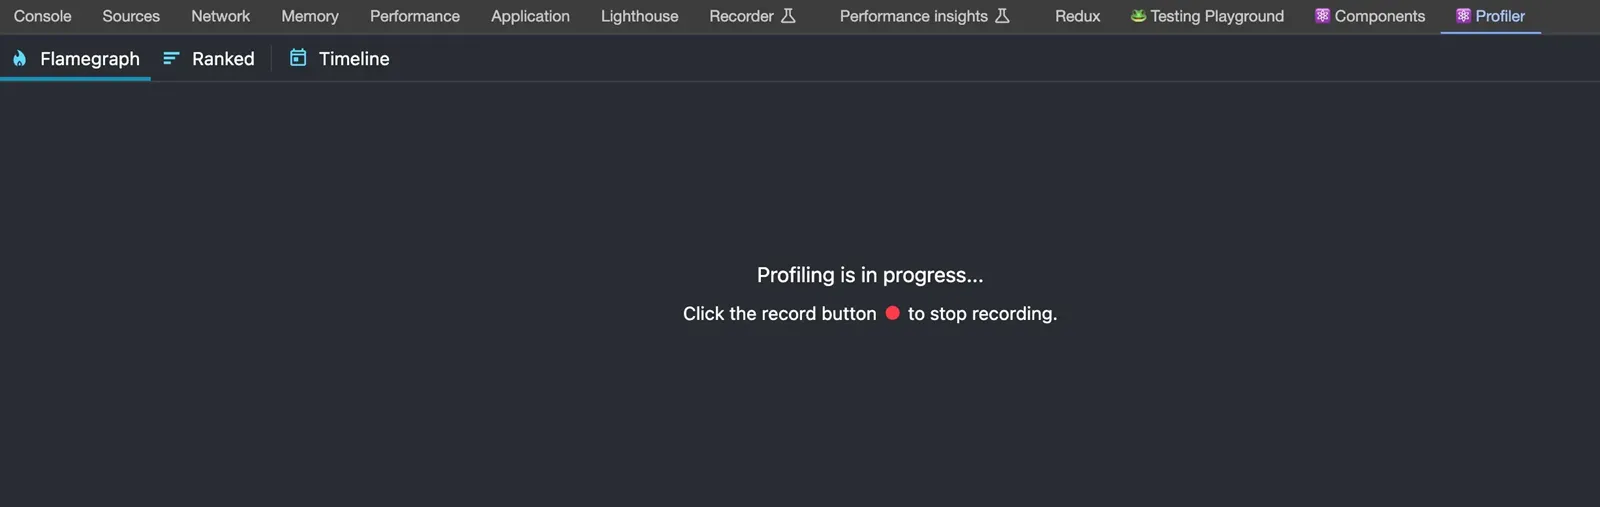
- Switch to the "⚛️ Profiler" tab in Developer Tools.
- Click the blue circular record button (Start profiling) in the top left corner.
- Interact with your app. Perform actions you suspect may cause performance issues, such as typing in forms, clicking buttons, filtering lists, etc. React DevTools will collect data during this time.
- Click the red stop button (Stop profiling) to end the recording.
After stopping, the Profiler will display the performance data it collected, ready for you to analyze.
Understanding the Profiler Interface: Flamegraph and Ranked Chart
Profiling data is presented in several chart types, with the two most important being the Flamegraph and Ranked chart.
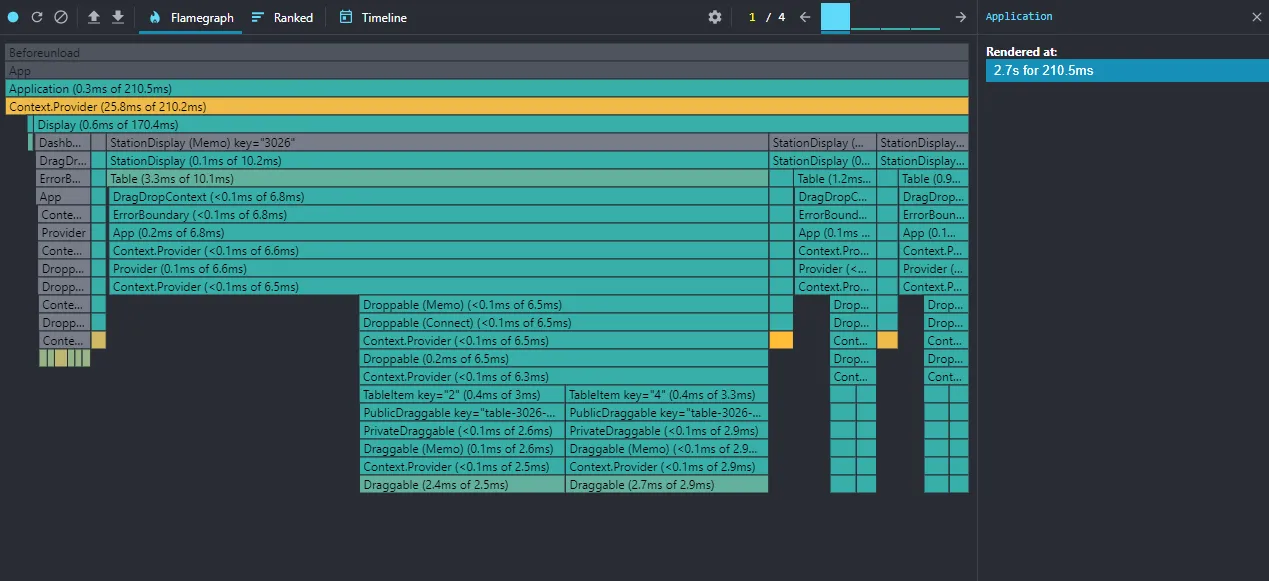
1. Flamegraph
This is the default view, giving you an overview of your component tree at a specific render (a "commit").
- Horizontal axis (Width): Each bar represents a component. The width of the bar shows how long that component and its children took to render. Wider bars mean longer render times.
- Vertical axis (Hierarchy): The chart shows the component hierarchy. Parent components are above and contain their children.
- Colors: Bar colors also have meaning. Warm colors (yellow, orange) indicate components that took longer to render, while cool colors (blue, green) show faster renders. Gray bars mean the component didn’t render in this commit.
Clicking a component in the chart shows detailed info in the right panel, including render time and why it re-rendered. This is a crucial clue for finding unnecessary re-renders.
2. Ranked Chart
If you want to know exactly which component took the most time to render in a commit, switch to the "Ranked" view.
This view lists components in descending order of render time. The slowest component is at the top. This helps you quickly spot the main culprits without scanning the entire component tree.
Diagnosing Performance: Common Scenarios and Solutions
Now that you know how to read the data, let’s apply it to find and fix common performance issues.
Scenario 1: Unnecessary Re-renders
This is the most common issue. A component re-renders even though its props and state haven’t changed.
- Sign: In the Flamegraph, you see a colored bar (not gray), but in the right panel under "Why did this render?" there’s no change in props or state.
- Solution: Use
React.memoto wrap the component.React.memodoes a shallow comparison of props and only re-renders if they change.
Example:
// Before optimization
const UserProfile = ({ user }) => {
  console.log('UserProfile rendered')
  return <div>{user.name}</div>
}

// After optimization
import { memo } from 'react'

const UserProfile = memo(({ user }) => {
  console.log('UserProfile rendered')
  return <div>{user.name}</div>
})
Scenario 2: Heavy Computation in Render
A component may perform expensive calculations or data processing directly in its render function. Every render, this calculation runs again.
- Sign: In the Ranked chart, a component consistently ranks high in render time. Looking at its code, you see complex loops or heavy data processing.
- Solution: Use the
useMemohook to memoize expensive calculations.useMemoonly recalculates when its dependencies change.
Example:
// Before optimization
const TodoList = ({ todos }) => {
  const visibleTodos = filterTodos(todos, 'all') // Expensive function
  return <ul>...</ul>
}

// After optimization
import { useMemo } from 'react'

const TodoList = ({ todos }) => {
  const visibleTodos = useMemo(() => filterTodos(todos, 'all'), [todos])
  return <ul>...</ul>
}
Tips for Using the Profiler
Finally, here are 3 short but useful tips:
- Profile in production builds: Always analyze performance on a production build (
npm run build). Development data may not reflect real-world performance. - Focus on user interactions: Don’t profile randomly. Focus on important user flows or areas where users notice slowness.
- Don’t optimize prematurely: Only optimize after you’ve identified real issues with the Profiler. Premature optimization can make your code unnecessarily complex.
Mastering the React Profiler not only helps you build faster apps, but also gives you deeper insight into how React works. Make it an essential part of your workflow to create high-quality, high-performance web products.
Happy coding with React!
![[React Basics] Guide to Setting Up a React Development Environment](/images/blog/how-to-set-up-a-react-development-environment.webp)
![[React Basics] How to Deploy a React App Easily in 5 Minutes](/images/blog/typescript-with-react.webp)
![[React Basics] Mastering the useRef Hook in React with Practical Examples](/images/blog/useref-hook.webp)
![[React Basics] A Guide to Testing in React: Ensuring Your App Works Perfectly](/images/blog/testing-in-react.webp)