Every Spring Boot application logs from its first second. The banner has barely scrolled past before Starting DemoApplication appears, followed by Tomcat and a Started line. You added no logging dependency and wrote no configuration for any of it: spring-boot-starter-webmvc brought a complete logging stack along, and Boot configured it before your first bean existed.
This article takes that stack apart. Which jar is the API and which one writes the output, how logs from libraries that use other APIs end up in the same stream, how levels and the logger hierarchy decide what gets printed, what each part of the default line means, how to write to a rotating file, and when you need a logback-spring.xml of your own. It is the last article of Chapter 2.
Everything below was produced on OpenJDK 21.0.6 with Spring Boot 4.1.1 (Spring Framework 7.0.9, Logback 1.5.38, SLF4J 2.0.18) and Gradle 9.7.1, using a project generated by Spring Initializr with dependencies=web. Each run passes its logging.* properties as -- command-line arguments, which Boot treats exactly like entries in application.properties, and every line of output is copied from those runs.
SLF4J is the API, Logback writes the output
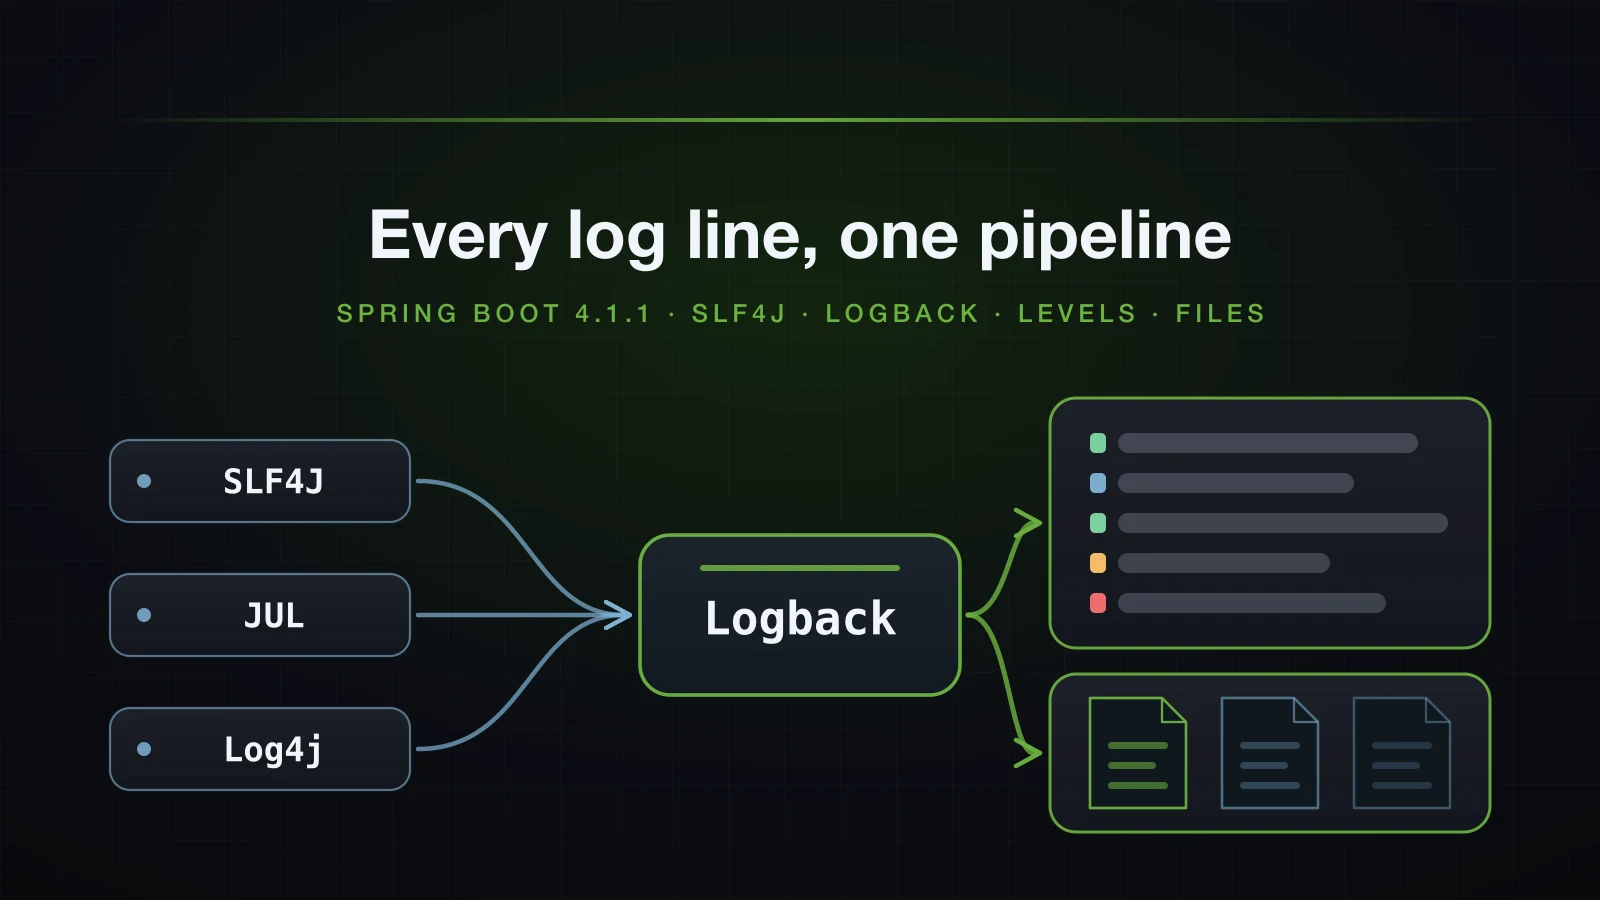
Your classes never call Logback. They call SLF4J (Simple Logging Facade for Java), a small API — Logger, LoggerFactory, MDC — that contains no output logic at all. At runtime SLF4J looks for a provider on the classpath and forwards every call to it. In a Spring Boot application that provider is Logback, and Logback owns everything that matters: which levels are enabled, how a line is formatted, and whether it goes to the console, a file, or both.
The split exists because of libraries. Tomcat, Hibernate, a payment SDK — each needs to log, and none of them can know whether the application using it has chosen Logback, Log4j2 or something else. A library that called Logback directly would force Logback on every user and clash with any application that picked differently. A library that compiles against the facade only leaves the choice to the application: whatever implementation the application puts on the classpath receives the output.
The same rule is worth following in your own code. Import org.slf4j.Logger, never ch.qos.logback.classic.Logger, and replacing Logback later is a build file change rather than a code change. This article does exactly that near the end.
The logging jars already on your classpath
./gradlew dependencies --configuration runtimeClasspath on the generated project, trimmed to the logging part of the tree:
\--- org.springframework.boot:spring-boot-starter-webmvc -> 4.1.1
     +--- org.springframework.boot:spring-boot-starter:4.1.1
     |    +--- org.springframework.boot:spring-boot-starter-logging:4.1.1
     |    |    +--- ch.qos.logback:logback-classic:1.5.38
     |    |    |    +--- ch.qos.logback:logback-core:1.5.38
     |    |    |    \--- org.slf4j:slf4j-api:2.0.17 -> 2.0.18
     |    |    +--- org.apache.logging.log4j:log4j-to-slf4j:2.25.5
     |    |    |    +--- org.apache.logging.log4j:log4j-api:2.25.5
     |    |    |    \--- org.slf4j:slf4j-api:2.0.17 -> 2.0.18
     |    |    \--- org.slf4j:jul-to-slf4j:2.0.18
     |    |         \--- org.slf4j:slf4j-api:2.0.18
     |    +--- org.springframework.boot:spring-boot-autoconfigure:4.1.1
     |    |    \--- org.springframework.boot:spring-boot:4.1.1
     |    |         +--- org.springframework:spring-core:7.0.9
     |    |         |    +--- commons-logging:commons-logging:1.3.5 -> 1.3.6
You never declare spring-boot-starter-logging. It comes through spring-boot-starter, which every other starter depends on. What each jar is for:
| Jar | Role |
|---|---|
slf4j-api 2.0.18 | the facade: Logger, LoggerFactory, MDC |
logback-classic 1.5.38 | the SLF4J provider: loggers, levels, pattern layout |
logback-core 1.5.38 | appenders, encoders and rolling policies |
jul-to-slf4j 2.0.18 | bridge from java.util.logging into SLF4J |
log4j-to-slf4j 2.25.5 | bridge from the Log4j API into SLF4J |
log4j-api 2.25.5 | the Log4j API itself, so libraries written against it still run |
commons-logging 1.3.6 | the API that Spring Framework's own classes log through |
Bridges put every logging API into one pipeline
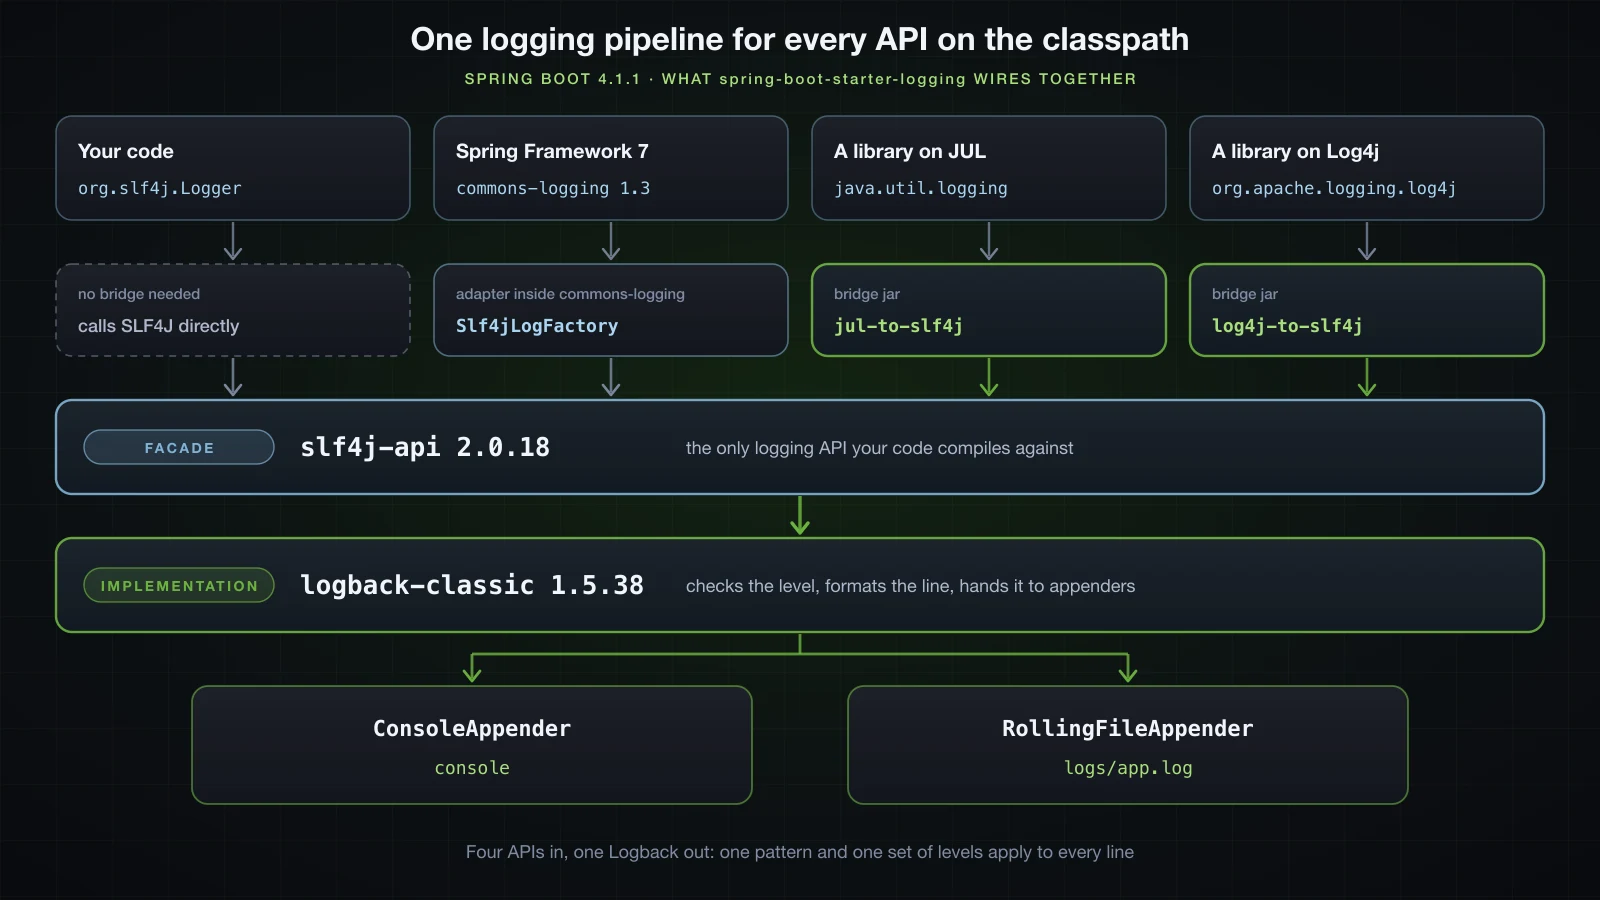
Not every library uses SLF4J. Some use java.util.logging (JUL) from the JDK, some use the Log4j API, and Spring Framework itself logs through Apache Commons Logging. Left alone, each API would configure itself: its own format, its own levels, its own destination. The bridge jars prevent that by implementing the foreign API and forwarding every call into SLF4J:
log4j-to-slf4jis a Log4j API provider whose loggers are SLF4J loggers.jul-to-slf4jprovidesSLF4JBridgeHandler, a JUL handler that republishes each record to SLF4J. It only works once it is installed on JUL's root logger, and Boot installs it during startup.- Commons Logging 1.3, which Spring Framework 7 depends on directly, needs no bridge jar. It detects SLF4J on the classpath and uses an adapter it ships itself.
Proving it takes one ApplicationRunner that logs through all four APIs:
@Component
class BridgeDemo implements ApplicationRunner {

    private static final org.slf4j.Logger slf4j =
            org.slf4j.LoggerFactory.getLogger(BridgeDemo.class);
    private static final java.util.logging.Logger jul =
            java.util.logging.Logger.getLogger("com.legacy.JulClient");
    private static final org.apache.logging.log4j.Logger log4j =
            org.apache.logging.log4j.LogManager.getLogger("com.legacy.Log4jClient");
    private static final org.apache.commons.logging.Log jcl =
            org.apache.commons.logging.LogFactory.getLog("com.legacy.JclClient");

    @Override
    public void run(ApplicationArguments args) {
        slf4j.info("hello from the SLF4J API");
        jul.info("hello from java.util.logging");
        log4j.info("hello from the Log4j API");
        jcl.info("hello from Commons Logging");
    }
}2026-09-11T14:42:37.888+07:00 INFO 46059 --- [demo] [ main] com.example.demo.BridgeDemo : hello from the SLF4J API
2026-09-11T14:42:37.888+07:00 INFO 46059 --- [demo] [ main] com.legacy.JulClient : hello from java.util.logging
2026-09-11T14:42:37.888+07:00 INFO 46059 --- [demo] [ main] com.legacy.Log4jClient : hello from the Log4j API
2026-09-11T14:42:37.888+07:00 INFO 46059 --- [demo] [ main] com.legacy.JclClient : hello from Commons LoggingFour APIs, one format: the same timestamp, the same PID column, the same padded logger name. JUL on its own would have printed a two-line record in a completely different layout. Printing the class behind each API from the same runner shows who does the work:
SLF4J ILoggerFactory : ch.qos.logback.classic.LoggerContext
Log4j API logger     : org.apache.logging.slf4j.SLF4JLogger
Commons Logging Log  : org.apache.commons.logging.impl.Slf4jLogFactory$Slf4jLocationAwareLog
JUL root handlers    : [org.slf4j.bridge.SLF4JBridgeHandler@773c0293]
Levels travel through the bridges as well. Add a jul.fine(...) and a log4j.debug(...) call and run with logging.level.com.legacy=DEBUG:
2026-09-11T14:42:38.629+07:00 DEBUG 46063 --- [demo] [           main] com.legacy.JulClient                     : JUL fine
2026-09-11T14:42:38.629+07:00 DEBUG 46063 --- [demo] [           main] com.legacy.Log4jClient                   : Log4j debug
JUL's FINE arrives as DEBUG, and jul.isLoggable(Level.FINE) changes from false in the default run to true in this one. The level you set through Boot is visible inside JUL itself, so a disabled JUL call is dropped before it ever reaches the bridge.
Getting a logger in a Spring Boot class
The two services below are used in every demo from here on. Their loggers are the ordinary SLF4J form:
package com.example.demo.orders;

import org.slf4j.Logger;
import org.slf4j.LoggerFactory;
import org.springframework.stereotype.Service;

@Service
public class OrderService {

    private static final Logger log = LoggerFactory.getLogger(OrderService.class);

    public void place(String orderId) {
        log.trace("Validating order {}", orderId);
        log.debug("Reserving stock for order {}", orderId);
        log.info("Order {} placed", orderId);
    }
}package com.example.demo.billing;
import org.slf4j.Logger;
import org.slf4j.LoggerFactory;
import org.springframework.stereotype.Service;
@Service
public class BillingService {
private static final Logger log = LoggerFactory.getLogger(BillingService.class);
public void charge(String orderId, long amount) {
log.debug("Calling payment gateway for order {}", orderId);
log.info("Charged {} VND for order {}", amount, orderId);
if (amount > 1_000_000) {
log.warn("Large payment of {} VND for order {}", amount, orderId);
}
}
}Three details are worth knowing:
- The logger's name is the fully qualified class name.
LoggerFactory.getLogger(BridgeDemo.class).getName()returnedcom.example.demo.BridgeDemoin the run above. That name is not a label — it is the key every level setting in the rest of this article is matched against. private static final: one logger per class, created when the class loads. A logger is not a Spring bean and needs no injection;LoggerFactoryhands back the same logger for the same name.- Import from
org.slf4j. IDE auto-import happily offersjava.util.logging.Loggerororg.apache.logging.log4j.Loggertoo. Thanks to the bridges they would still work, but they tie the class to a different API.
Lombok's @Slf4j annotation generates exactly this log field for you; Lombok itself is covered in Chapter 7.
Parameterised logging instead of string concatenation
SLF4J methods take a message with {} placeholders and the values separately. The difference from string concatenation is not style, and it is easy to measure. Cart below counts how often its toString() is called, and checksum() counts its own calls:
static class Cart {
    static int toStringCalls = 0;

    @Override
    public String toString() {
        toStringCalls++;
        return "Cart[items=3, total=450000]";
    }
}

static int checksumCalls = 0;

static String checksum(Cart cart) {
    checksumCalls++;
    return "9f2c1a";
}

@Override
public void run(ApplicationArguments args) {
    Cart cart = new Cart();
    System.out.println("isDebugEnabled() = " + log.isDebugEnabled());

    log.debug("Cart contents: " + cart);
    System.out.println("concatenation      -> toString() calls: " + Cart.toStringCalls);

    log.debug("Cart contents: {}", cart);
    System.out.println("{} placeholder     -> toString() calls: " + Cart.toStringCalls);

    log.atDebug().setMessage("Cart contents: {}").addArgument(cart).log();
    System.out.println("fluent API         -> toString() calls: " + Cart.toStringCalls);

    log.debug("Cart checksum: {}", checksum(cart));
    System.out.println("method as argument -> checksum() calls: " + checksumCalls);

    log.atDebug().setMessage("Cart checksum: {}").addArgument(() -> checksum(cart)).log();
    System.out.println("supplier argument  -> checksum() calls: " + checksumCalls);
}
With Boot's defaults DEBUG is disabled, so none of the five debug calls prints anything:
isDebugEnabled() = false
concatenation      -> toString() calls: 1
{} placeholder     -> toString() calls: 1
fluent API         -> toString() calls: 1
method as argument -> checksum() calls: 1
supplier argument  -> checksum() calls: 1
Read the counters one line at a time:
- Concatenation called
toString()even though nothing was logged. Java evaluates"Cart contents: " + cartbeforedebug()is even invoked, so the string is built and then thrown away. - The
{}version did not. SLF4J receives the pattern and the object, checks the level first, and formats only if the line will actually be written. The counter stayed at 1. {}defers formatting, not argument evaluation.log.debug("Cart checksum: {}", checksum(cart))still ranchecksum(), because Java evaluates method arguments before the call. The placeholder cannot help there.- A supplier can. The last call passed
() -> checksum(cart)and the counter did not move.
A method call inside a disabled debug statement is cheap until it is a database query, a JSON serialisation or a loop over ten thousand items. In a hot path, that work runs on every request and its output is never seen.
The SLF4J 2 fluent API and lazy arguments
SLF4J 2.0 added a builder-style API: atTrace(), atDebug(), atInfo(), atWarn(), atError() return a LoggingEventBuilder, and the event is only emitted when you call log(). When the level is disabled, the builder is a no-op, which is why the fluent addArgument(cart) did not call toString() either.
Its real advantage is addArgument(Supplier<?>). The lambda is invoked only if the line is written. Running the same code with logging.level.com.example=DEBUG shows both sides:
isDebugEnabled() = true
2026-09-11T14:42:41.781+07:00 DEBUG 46075 --- [demo] [           main] com.example.demo.ParamsDemo              : Cart contents: Cart[items=3, total=450000]
concatenation      -> toString() calls: 1
2026-09-11T14:42:41.781+07:00 DEBUG 46075 --- [demo] [           main] com.example.demo.ParamsDemo              : Cart contents: Cart[items=3, total=450000]
{} placeholder     -> toString() calls: 2
2026-09-11T14:42:41.782+07:00 DEBUG 46075 --- [demo] [           main] com.example.demo.ParamsDemo              : Cart contents: Cart[items=3, total=450000]
fluent API         -> toString() calls: 3
2026-09-11T14:42:41.782+07:00 DEBUG 46075 --- [demo] [           main] com.example.demo.ParamsDemo              : Cart checksum: 9f2c1a
method as argument -> checksum() calls: 1
2026-09-11T14:42:41.782+07:00 DEBUG 46075 --- [demo] [           main] com.example.demo.ParamsDemo              : Cart checksum: 9f2c1a
supplier argument  -> checksum() calls: 2
When the line is written, every form does the work exactly once. The only difference is what happens when it is not:
| Call | Work done when DEBUG is disabled |
|---|---|
log.debug("Cart: " + cart) | yes — the string is built and discarded |
log.debug("Cart: {}", cart) | none — toString() is never called |
log.debug("Checksum: {}", checksum(cart)) | yes — checksum() runs |
log.atDebug().setMessage("Checksum: {}").addArgument(() -> checksum(cart)).log() | none — the supplier is never called |
if (log.isDebugEnabled()) { ... } | none — the block is skipped |
Use {} everywhere. Reach for a supplier or an isDebugEnabled() guard only when producing an argument is itself expensive; the guard is the better choice when preparing the arguments takes several statements.
Logging exceptions with their stack trace
SLF4J has one special rule for exceptions: if the last argument is a Throwable, it is logged as the exception, with its stack trace. Three ways of logging the same NumberFormatException:
String raw = "12x";
try {
    parseQuantity(raw);                                   // Integer.parseInt(raw)
} catch (NumberFormatException e) {
    log.error("Failed to parse quantity '{}'", raw, e);   // A
    log.error("Failed to parse quantity: " + e);          // B
    log.error("Failed to parse quantity: {}", e);         // C
}
A — exception as the last argument, after the placeholder values:
2026-09-11T14:42:42.454+07:00 ERROR 46077 --- [demo] [           main] com.example.demo.ExceptionDemo           : Failed to parse quantity '12x'

java.lang.NumberFormatException: For input string: "12x"
	at java.base/java.lang.NumberFormatException.forInputString(NumberFormatException.java:67) ~[na:na]
	at java.base/java.lang.Integer.parseInt(Integer.java:662) ~[na:na]
	at java.base/java.lang.Integer.parseInt(Integer.java:778) ~[na:na]
	at com.example.demo.ExceptionDemo.parseQuantity(ExceptionDemo.java:33) ~[!/:0.0.1-SNAPSHOT]
	at com.example.demo.ExceptionDemo.run(ExceptionDemo.java:20) ~[!/:0.0.1-SNAPSHOT]
Shown here are the first five frames; the real output continues with 25 more, all Spring Boot's runner and JDK frames. The blank lines around the trace come from Boot's %wEx converter, and the bracket after each frame names the jar and version the class was loaded from (na for JDK classes).
B — string concatenation:
2026-09-11T14:42:42.455+07:00 ERROR 46077 --- [demo] [ main] com.example.demo.ExceptionDemo : Failed to parse quantity: java.lang.NumberFormatException: For input string: "12x"One line. You get the exception's type and message, and nothing about where it was thrown or what caused it.
C — the exception given a placeholder of its own:
2026-09-11T14:42:42.455+07:00 ERROR 46077 --- [demo] [           main] com.example.demo.ExceptionDemo           : Failed to parse quantity: {}

java.lang.NumberFormatException: For input string: "12x"
	at java.base/java.lang.NumberFormatException.forInputString(NumberFormatException.java:67) ~[na:na]
The stack trace is back, but the {} is printed literally: SLF4J takes the trailing Throwable as the exception even when a placeholder is waiting for it. The rule that avoids all three surprises is simple — one {} per ordinary value, and the exception last, with no placeholder.
⚠️
log.error("failed: " + e)compiles, prints a plausible line and passes code review easily. It is also the reason a production incident gets investigated with no stack trace. Passeas the last argument.
Log levels in Spring Boot
SLF4J has five levels. A logger set to a level prints that level and everything more severe, and drops everything below it:
| Level | Use it for |
|---|---|
TRACE | step-by-step detail; off everywhere by default |
DEBUG | diagnostic detail for developers |
INFO | normal milestones: started, order placed |
WARN | something unexpected that the application handled |
ERROR | an operation failed |
OFF | not a message level; set it on a logger to silence that logger completely |
Spring Boot's default root level is INFO. Reading the root logger from Boot's LoggingSystem in the running application shows INFO as both its configured and its effective level. On top of that, Boot's defaults.xml pre-sets a few noisy third-party loggers, for example org.apache.catalina.startup.DigesterFactory to ERROR and org.apache.coyote.http11.Http11NioProtocol to WARN.
In the demos below, an ApplicationRunner calls orderService.place("A-1001") and billingService.charge("A-1001", 2_500_000) once at startup. With no level settings, the two services print:
2026-09-11T14:42:52.189+07:00  INFO 46249 --- [demo] [           main] com.example.demo.orders.OrderService     : Order A-1001 placed
2026-09-11T14:42:52.189+07:00  INFO 46249 --- [demo] [           main] c.example.demo.billing.BillingService    : Charged 2500000 VND for order A-1001
2026-09-11T14:42:52.189+07:00  WARN 46249 --- [demo] [           main] c.example.demo.billing.BillingService    : Large payment of 2500000 VND for order A-1001
logging.level.<logger name> changes one logger and everything under it. root is the special name for the top of the tree:
logging.level.root=WARNThat run printed exactly one log line from start to finish — the WARN. Boot's own startup lines are INFO, so they went too:
2026-09-11T14:42:52.840+07:00 WARN 46251 --- [demo] [ main] c.example.demo.billing.BillingService : Large payment of 2500000 VND for order A-1001Going the other way, for your own packages only:
logging.level.com.example=DEBUG2026-09-11T14:42:53.436+07:00 DEBUG 46257 --- [demo] [ main] com.example.demo.orders.OrderService : Reserving stock for order A-1001
2026-09-11T14:42:53.437+07:00 INFO 46257 --- [demo] [ main] com.example.demo.orders.OrderService : Order A-1001 placed
2026-09-11T14:42:53.437+07:00 DEBUG 46257 --- [demo] [ main] c.example.demo.billing.BillingService : Calling payment gateway for order A-1001
2026-09-11T14:42:53.437+07:00 INFO 46257 --- [demo] [ main] c.example.demo.billing.BillingService : Charged 2500000 VND for order A-1001
2026-09-11T14:42:53.437+07:00 WARN 46257 --- [demo] [ main] c.example.demo.billing.BillingService : Large payment of 2500000 VND for order A-1001Both DEBUG lines appeared; the TRACE line in OrderService did not, because TRACE is below DEBUG. The same setting also makes Boot print Running with Spring Boot v4.1.1, Spring v7.0.9 at startup, since that line is logged at DEBUG through your application class's logger.
The most useful framework setting while building an API is org.springframework.web. With logging.level.org.springframework.web=DEBUG and one request to GET /orders/A-1001:
2026-09-11T14:47:18.128+07:00 DEBUG 48619 --- [demo] [nio-8094-exec-1] o.s.web.servlet.DispatcherServlet        : GET "/orders/A-1001", parameters={}
2026-09-11T14:47:18.133+07:00 DEBUG 48619 --- [demo] [nio-8094-exec-1] s.w.s.m.m.a.RequestMappingHandlerMapping : Mapped to com.example.demo.web.OrderController#place(String)
2026-09-11T14:47:18.140+07:00  INFO 48619 --- [demo] [nio-8094-exec-1] com.example.demo.orders.OrderService     : Order A-1001 placed
2026-09-11T14:47:18.141+07:00  INFO 48619 --- [demo] [nio-8094-exec-1] c.example.demo.billing.BillingService    : Charged 450000 VND for order A-1001
2026-09-11T14:47:18.144+07:00 DEBUG 48619 --- [demo] [nio-8094-exec-1] m.m.a.RequestResponseBodyMethodProcessor : Using 'text/plain', given [*/*] and supported [text/plain, */*, application/json, application/*+json]
2026-09-11T14:47:18.144+07:00 DEBUG 48619 --- [demo] [nio-8094-exec-1] m.m.a.RequestResponseBodyMethodProcessor : Writing ["placed A-1001<EOL>"]
2026-09-11T14:47:18.147+07:00 DEBUG 48619 --- [demo] [nio-8094-exec-1] o.s.web.servlet.DispatcherServlet        : Completed 200 OK
The request, the handler method it was mapped to, the content type chosen for the response, and the status — without a debugger. The run produced 14 DEBUG lines in total: these five for the request, five more when DispatcherServlet initialised on the first request, and four at startup summarising the handler mappings.
How the logger hierarchy inherits levels
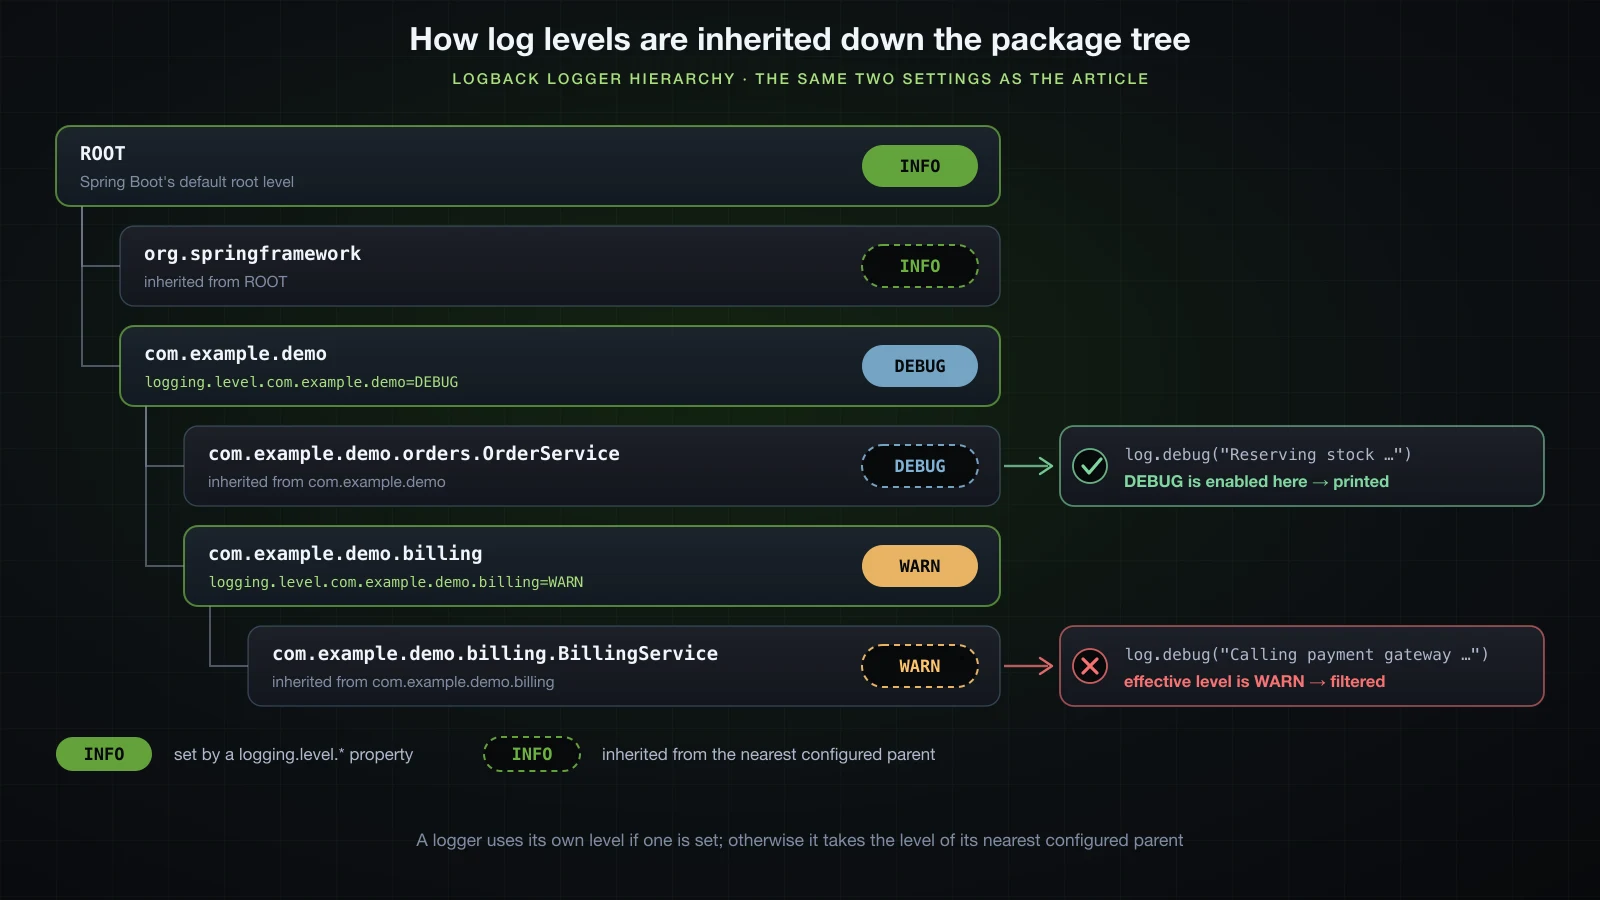
Logback arranges loggers into a tree using the dots in their names. com.example.demo.billing.BillingService is a child of com.example.demo.billing, which is a child of com.example.demo, and so on up to ROOT. A logger with no level of its own uses the level of its nearest ancestor that has one.
That is why one property covered both services above, and it is what lets a more specific setting override a general one:
logging.level.com.example.demo=DEBUG
logging.level.com.example.demo.billing=WARN2026-09-11T14:56:40.478+07:00 DEBUG 53690 --- [demo] [ main] com.example.demo.orders.OrderService : Reserving stock for order A-1001
2026-09-11T14:56:40.479+07:00 INFO 53690 --- [demo] [ main] com.example.demo.orders.OrderService : Order A-1001 placed
2026-09-11T14:56:40.479+07:00 WARN 53690 --- [demo] [ main] c.example.demo.billing.BillingService : Large payment of 2500000 VND for order A-1001OrderService has no level, so it inherits DEBUG from com.example.demo and prints its DEBUG line. BillingService has no level either, but its nearest configured ancestor is com.example.demo.billing, set to WARN — so its DEBUG and INFO lines are both gone and only the warning remains. The two settings are on different loggers, so the order you write them in does not matter.
OFF works the same way. logging.level.com.example.demo.billing=OFF removed the WARN line as well, leaving only Order A-1001 placed.
Log groups: one property for several loggers
When the loggers you care about are in unrelated packages, a group names them once:
logging.group.app=com.example.demo.orders,com.example.demo.billing
logging.level.app=DEBUG
That run printed the same five lines as logging.level.com.example=DEBUG above — both DEBUG lines, both INFO lines and the warning.
Boot defines two groups of its own. Their members in 4.1.1, read from LoggingApplicationListener and confirmed by listing the LoggerGroups bean in the running application:
| Group | Loggers |
|---|---|
web | org.springframework.core.codec, org.springframework.http, org.springframework.web, org.springframework.boot.actuate.endpoint.web, org.springframework.boot.web.servlet.ServletContextInitializerBeans |
sql | org.springframework.jdbc.core, org.hibernate.SQL, org.jooq.tools.LoggerListener |
logging.level.web=DEBUG is therefore slightly more than logging.level.org.springframework.web=DEBUG. The same request produced 16 DEBUG lines instead of 14, and the difference is two startup lines from ServletContextInitializerBeans listing every registered filter and servlet:
2026-09-11T14:47:19.528+07:00 DEBUG 48647 --- [demo] [           main] o.s.b.w.s.ServletContextInitializerBeans : Mapping filters: characterEncodingFilter urls=[/*] order=-2147483648, formContentFilter urls=[/*] order=-9900, requestContextFilter urls=[/*] order=-105, requestIdFilter urls=[/*] order=2147483647
2026-09-11T14:47:19.528+07:00 DEBUG 48647 --- [demo] [ main] o.s.b.w.s.ServletContextInitializerBeans : Mapping servlets: dispatcherServlet urls=[/](requestIdFilter is the filter from the MDC section later in this article.) The sql group becomes useful in Chapter 4, once there is a database to talk to.
--debug versus --trace: what each flag changes
Article 10 used --debug to print the conditions evaluation report. Both flags also change log levels — but only for a fixed list of framework loggers, not for your application. The list is a constant in LoggingApplicationListener, and the effective levels below were read back from the running application:
| Flag | Loggers it changes | Output of the web app, startup plus 1.5 s idle |
|---|---|---|
| none | — | 8 lines |
--debug or debug=true | groups web and sql, plus org.springframework.boot → DEBUG | 424 lines, 21 of them DEBUG, plus the conditions report |
--trace or trace=true | org.springframework, org.apache.tomcat, org.apache.catalina, org.eclipse.jetty, org.hibernate.tool.hbm2ddl → TRACE | 2,392 lines: 1,539 TRACE and 287 DEBUG, plus the conditions report |
Two things follow from that table:
- Neither flag touches your code's loggers.
com.example.demostayed at INFO under both, and theRunning with Spring Boot v4.1.1, Spring v7.0.9DEBUG line — which appears as soon as you setlogging.level.com.example=DEBUG— appeared in neither run. If your ownlog.debug(...)is not printing,--debugwill not fix it. --traceis a firehose. 1,174 of its lines came from a single logger,DefaultListableBeanFactory, narrating every bean it creates. It is useful when you are chasing a bean creation problem and useless as a default.
ROOT stays at INFO under both flags, so third-party libraries outside those lists are unaffected.
Anatomy of the default Spring Boot log line
Boot's console pattern is defined in org/springframework/boot/logging/logback/defaults.xml inside spring-boot-4.1.1.jar:
<property name="CONSOLE_LOG_PATTERN" value="${CONSOLE_LOG_PATTERN:-%clr(%d{${LOG_DATEFORMAT_PATTERN:-yyyy-MM-dd'T'HH:mm:ss.SSSXXX}}){faint} %clr(${LOG_LEVEL_PATTERN:-%5p}){} %clr(${PID:-}){magenta} %clr(--- %esb(){APPLICATION_NAME}%esb{APPLICATION_GROUP}[%15.15t] ${LOG_CORRELATION_PATTERN:-}){faint}%clr(%-40.40logger{39}){cyan} %clr(:){faint} %m%n${LOG_EXCEPTION_CONVERSION_WORD:-%wEx}}"/>And this is one line it produced, from the first request to the web application:
2026-09-11T14:45:17.515+07:00 INFO 47420 --- [demo] [nio-8094-exec-1] o.s.web.servlet.DispatcherServlet : Initializing Servlet 'dispatcherServlet'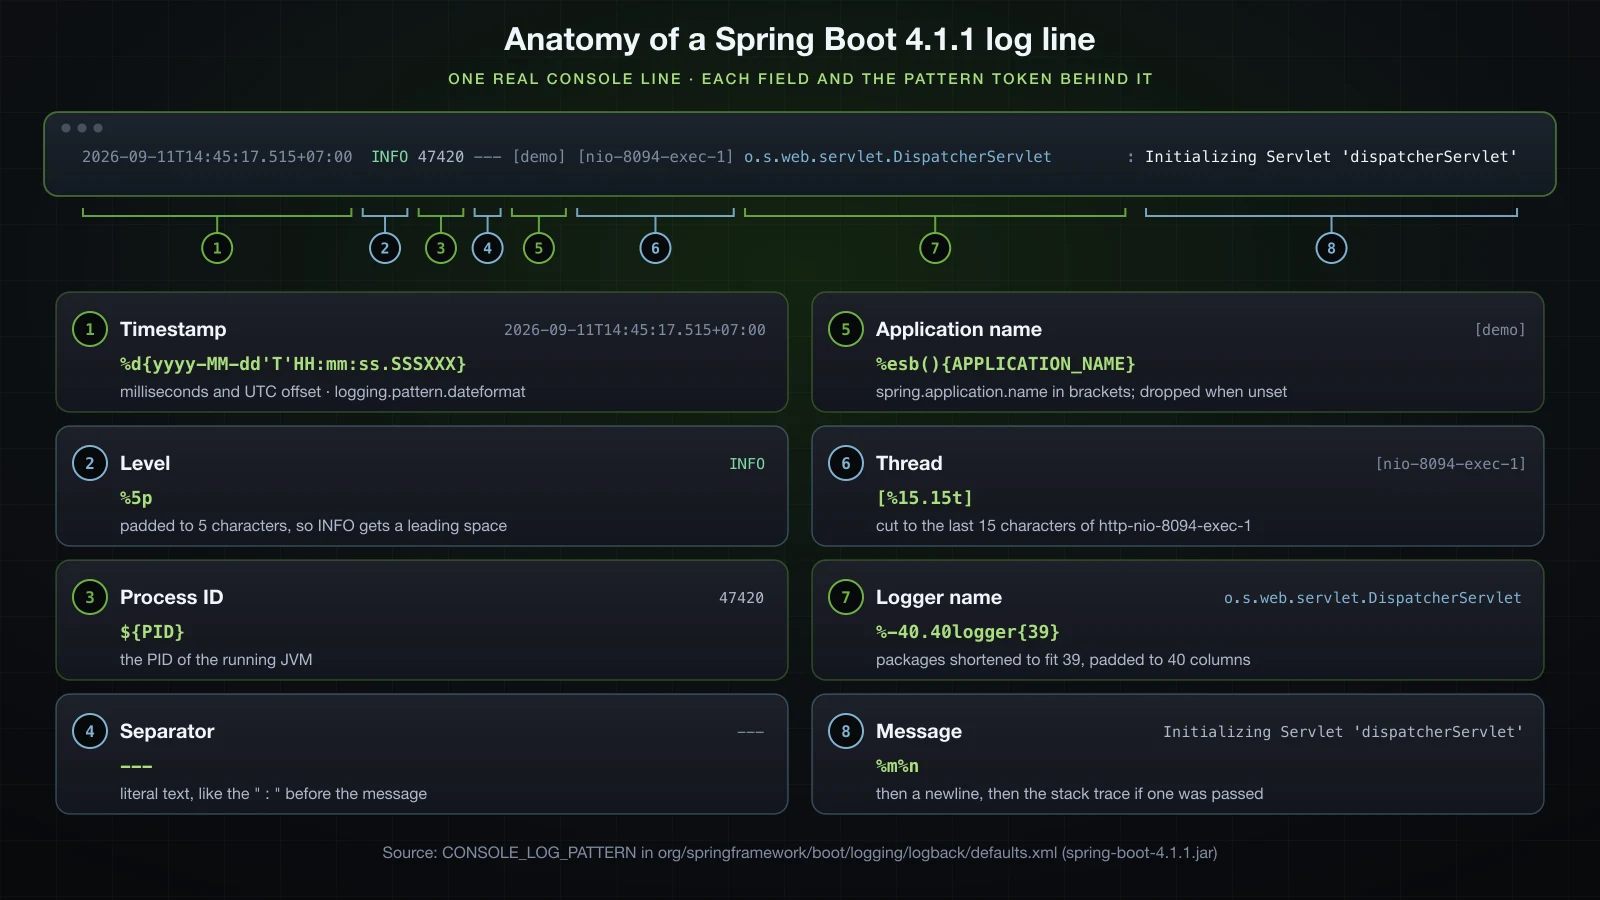
Most of the tokens explain themselves once the picture pairs them up. The ones worth a closer look:
${LOG_DATEFORMAT_PATTERN:-...}and${LOG_LEVEL_PATTERN:-%5p}are the hooks behindlogging.pattern.dateformatandlogging.pattern.level. They let you change one part without rewriting the rest.%esb(){APPLICATION_NAME}printsspring.application.namein square brackets with a trailing space. Initializr'sapplication.propertiessetsspring.application.name=demo, hence[demo]. Running with an empty configuration file instead, the field disappears entirely and the line reads--- [ main].%esb{APPLICATION_GROUP}does the same forspring.application.group, which is unset here.[%15.15t]pads the thread name to 15 characters and truncates it from the left: Tomcat'shttp-nio-8094-exec-1becomesnio-8094-exec-1, andmainbecomes eleven spaces andmain.%-40.40logger{39}shortens the logger name, then pads it to 40 columns. Shortening abbreviates packages from the left and never touches the class name. This project shows the boundary:com.example.demo.orders.OrderService(36 characters) is printed in full, whilecom.example.demo.billing.BillingService(39 characters) becomesc.example.demo.billing.BillingService.${LOG_CORRELATION_PATTERN:-}is empty unless tracing supplies trace and span ids, which belongs to the Advanced course.%clr(...)adds colour, and%wExprints the stack trace with a blank line on each side, as seen in the exception section.
The file pattern next to it in defaults.xml is the same without %clr and with [%t] instead of [%15.15t], so file lines carry the full, unpadded thread name.
Customising the pattern with logging.pattern.console
logging.pattern.console replaces the whole console pattern. Anything you leave out — PID, thread, application name — is simply gone:
logging.pattern.console=%d{HH:mm:ss.SSS} %-5level %logger{20} - %msg%n14:45:29.431 INFO c.e.d.o.OrderService - Order A-1001 placed
14:45:29.431 INFO c.e.d.b.BillingService - Charged 2500000 VND for order A-1001
14:45:29.431 WARN c.e.d.b.BillingService - Large payment of 2500000 VND for order A-1001%logger{20} gives the abbreviation very little room, so every package collapses to its first letter.
When you only want a different date, logging.pattern.dateformat swaps that one part and keeps Boot's layout:
logging.pattern.dateformat=yyyy-MM-dd HH:mm:ss.SSS2026-09-11 14:45:30.144 INFO 47544 --- [demo] [ main] com.example.demo.orders.OrderService : Order A-1001 placed
2026-09-11 14:45:30.144 INFO 47544 --- [demo] [ main] c.example.demo.billing.BillingService : Charged 2500000 VND for order A-1001
2026-09-11 14:45:30.144 WARN 47544 --- [demo] [ main] c.example.demo.billing.BillingService : Large payment of 2500000 VND for order A-1001Colour output with spring.output.ansi.enabled
The %clr wrappers only emit colour codes when ANSI output is enabled. spring.output.ansi.enabled takes detect (the default), always or never. With detect, Boot colours the console when it is a terminal; piping the same application through cat -v showed plain text. Forcing it on and piping through cat -v makes the escape codes visible:
spring.output.ansi.enabled=always^[[2m2026-09-11T14:45:30.684+07:00^[[0;39m ^[[33m WARN^[[0;39m ^[[35m47546^[[0;39m ^[[2m--- [demo] [ main] ^[[0;39m^[[36mc.example.demo.billing.BillingService ^[[0;39m ^[[2m:^[[0;39m Large payment of 2500000 VND for order A-10012m is faint, 33m yellow for WARN (INFO lines got 32m, green), 35m magenta for the PID and 36m cyan for the logger. always helps when a CI log viewer understands ANSI colours; never is what you want when output is captured into files or shipped to a log collector, where the escape codes become noise.
Writing logs to a file
By default Spring Boot logs to the console only. One property adds a file:
logging.file.name=logs/app.logThe console kept printing exactly as before, and a new file appeared relative to the working directory:
./logs/app.log2026-09-11T14:45:27.519+07:00 INFO 47461 --- [demo] [main] com.example.demo.orders.OrderService : Order A-1001 placedThe line uses the file pattern: no colours, and [main] rather than a padded thread name.
The alternative property takes a directory and always uses the file name spring.log:
logging.file.path=logsThat run created ./logs/spring.log. Setting both properties at once — logging.file.name=logs/app.log and logging.file.path pointing at a var-log directory — created logs/app.log and no var-log directory at all. Boot's LogFile uses the name whenever it is set and only falls back to the path when it is not:
| Properties set | File written |
|---|---|
logging.file.name=logs/app.log | logs/app.log |
logging.file.path=logs | logs/spring.log |
| both | logs/app.log; logging.file.path is ignored |
| neither | no file, console only |
Log file rotation: size, history and total size cap
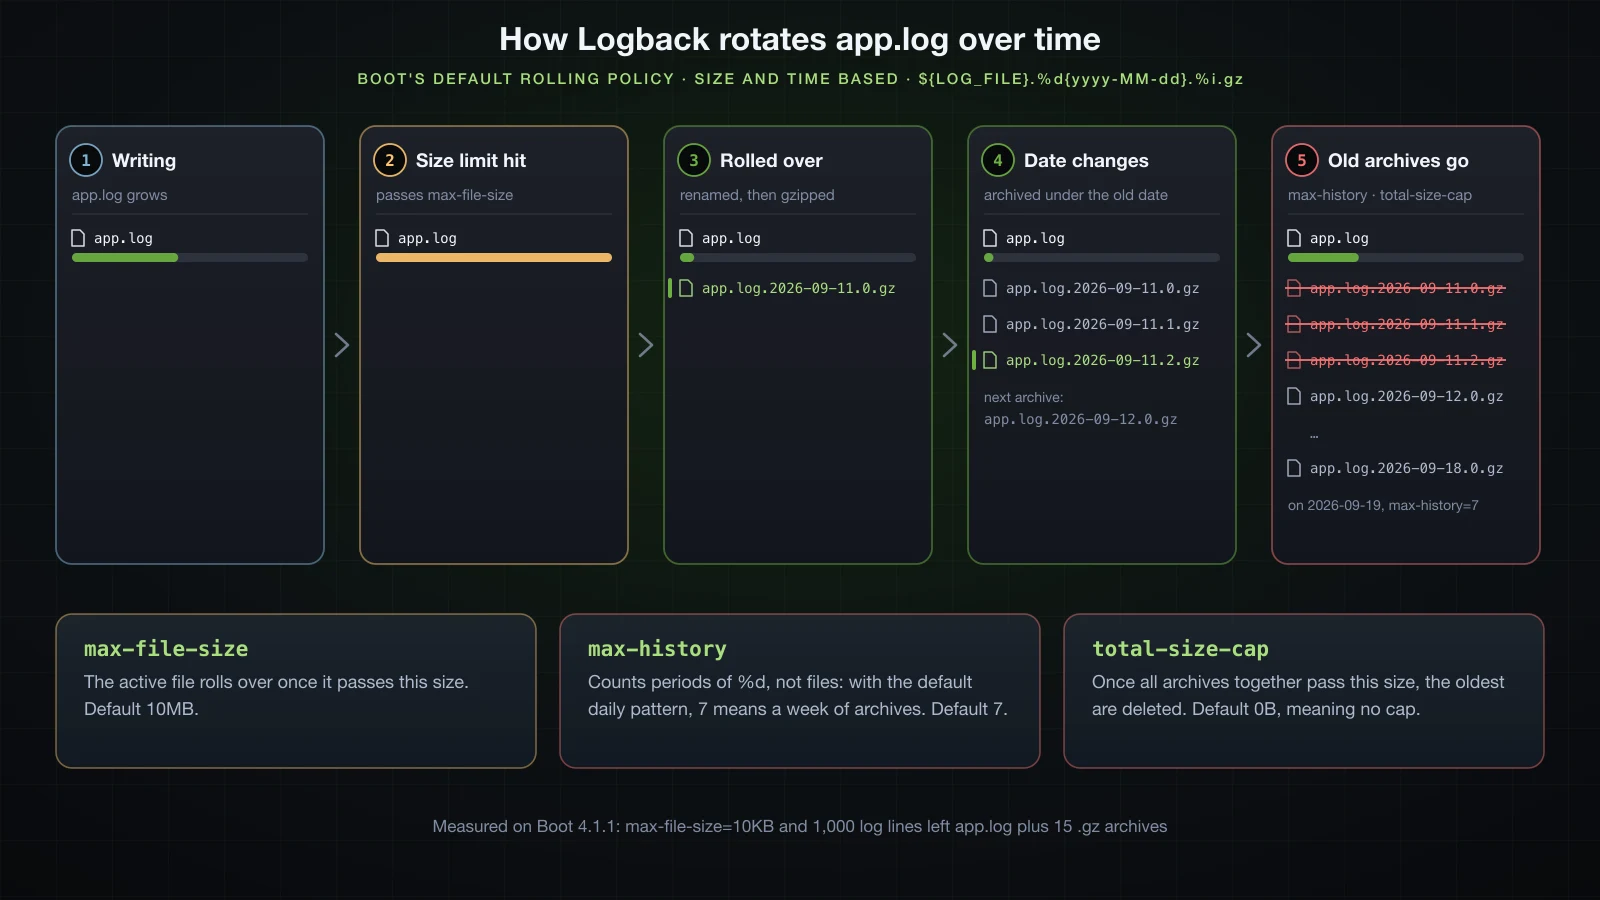
A log file that only grows eventually fills a disk. Boot's file appender uses Logback's SizeAndTimeBasedRollingPolicy, and file-appender.xml in the Boot jar — the XML equivalent of what Boot configures programmatically — shows the defaults:
<rollingPolicy class="ch.qos.logback.core.rolling.SizeAndTimeBasedRollingPolicy">
    <fileNamePattern>${LOGBACK_ROLLINGPOLICY_FILE_NAME_PATTERN:-${LOG_FILE}.%d{yyyy-MM-dd}.%i.gz}</fileNamePattern>
    <cleanHistoryOnStart>${LOGBACK_ROLLINGPOLICY_CLEAN_HISTORY_ON_START:-false}</cleanHistoryOnStart>
    <maxFileSize>${LOGBACK_ROLLINGPOLICY_MAX_FILE_SIZE:-10MB}</maxFileSize>
    <totalSizeCap>${LOGBACK_ROLLINGPOLICY_TOTAL_SIZE_CAP:-0}</totalSizeCap>
    <maxHistory>${LOGBACK_ROLLINGPOLICY_MAX_HISTORY:-7}</maxHistory>
</rollingPolicy>
In the file name pattern, %d is the date the archive belongs to, %i counts archives within that date, and the .gz suffix tells Logback to compress. To see it work without writing 10 MB, shrink the limit and log 1,000 lines in a loop:
logging.file.name=logs/app.log
logging.logback.rollingpolicy.max-file-size=10KB
ls -lgo logs afterwards:
total 128
-rw-r--r--@ 1   2341 Sep 11 14:45 app.log
-rw-r--r--@ 1    852 Sep 11 14:45 app.log.2026-09-11.0.gz
-rw-r--r--@ 1    555 Sep 11 14:45 app.log.2026-09-11.1.gz
-rw-r--r--@ 1    546 Sep 11 14:45 app.log.2026-09-11.10.gz
-rw-r--r--@ 1    544 Sep 11 14:45 app.log.2026-09-11.11.gz
-rw-r--r--@ 1    540 Sep 11 14:45 app.log.2026-09-11.12.gz
-rw-r--r--@ 1    545 Sep 11 14:45 app.log.2026-09-11.13.gz
-rw-r--r--@ 1    528 Sep 11 14:45 app.log.2026-09-11.14.gz
-rw-r--r--@ 1    559 Sep 11 14:45 app.log.2026-09-11.2.gz
-rw-r--r--@ 1    555 Sep 11 14:45 app.log.2026-09-11.3.gz
-rw-r--r--@ 1    537 Sep 11 14:45 app.log.2026-09-11.4.gz
-rw-r--r--@ 1    550 Sep 11 14:45 app.log.2026-09-11.5.gz
-rw-r--r--@ 1    552 Sep 11 14:45 app.log.2026-09-11.6.gz
-rw-r--r--@ 1    539 Sep 11 14:45 app.log.2026-09-11.7.gz
-rw-r--r--@ 1    551 Sep 11 14:45 app.log.2026-09-11.8.gz
-rw-r--r--@ 1    558 Sep 11 14:45 app.log.2026-09-11.9.gz
Fifteen archives, .0 to .14 (ls sorts .10 before .2), plus the active app.log. Each archive is about 550 bytes of gzip; decompressing app.log.2026-09-11.3.gz gives 66 lines and 10,286 bytes — the 10KB limit, just passed. Archive .0 is larger because it also holds the startup lines.
total-size-cap puts a ceiling on all archives together. Dropping the .gz from the pattern keeps the sizes readable:
logging.logback.rollingpolicy.file-name-pattern=logs/app-%d{yyyy-MM-dd}.%i.log
logging.logback.rollingpolicy.total-size-cap=40KBtotal 80
-rw-r--r--@ 1 10296 Sep 11 14:45 app-2026-09-11.12.log
-rw-r--r--@ 1 10286 Sep 11 14:45 app-2026-09-11.13.log
-rw-r--r--@ 1 10286 Sep 11 14:45 app-2026-09-11.14.log
-rw-r--r--@ 1 2341 Sep 11 14:45 app.logThe same run produced the same fifteen archives, and Logback deleted the oldest twelve: four archives of about 10KB would have passed 40KB, so three survived.
max-history is the property most often misunderstood. Boot's own description calls it the "maximum number of archive log files to keep", but it counts periods of the %d pattern, not files. A pattern that rolls every second makes that visible:
logging.logback.rollingpolicy.file-name-pattern=logs/app-%d{yyyy-MM-dd_HH-mm-ss}.%i.log
logging.logback.rollingpolicy.max-file-size=100KB
logging.logback.rollingpolicy.max-history=2total 1608
-rw-r--r--@ 1 102451 Sep 11 14:47 app-2026-09-11_14-47-34.0.log
-rw-r--r--@ 1 102453 Sep 11 14:47 app-2026-09-11_14-47-34.1.log
-rw-r--r--@ 1 101674 Sep 11 14:47 app-2026-09-11_14-47-34.2.log
-rw-r--r--@ 1 102451 Sep 11 14:47 app-2026-09-11_14-47-35.0.log
-rw-r--r--@ 1 102500 Sep 11 14:47 app-2026-09-11_14-47-35.1.log
-rw-r--r--@ 1 102482 Sep 11 14:47 app-2026-09-11_14-47-35.2.log
-rw-r--r--@ 1 7258 Sep 11 14:47 app-2026-09-11_14-47-35.3.log
-rw-r--r--@ 1 102475 Sep 11 14:47 app-2026-09-11_14-47-36.0.log
-rw-r--r--@ 1 71215 Sep 11 14:47 app.logmax-history=2 left eight archives from three consecutive seconds; everything older had been deleted. The same run with max-history=100 kept all 20 archives it produced, spread over seven seconds. With Boot's daily default pattern, the default of 7 therefore means roughly a week of archives, however many files each day produces — so on a busy service, total-size-cap is the setting that actually protects the disk.
Deletion normally happens when a rollover occurs. clean-history-on-start=true also runs it at startup. Restarting on top of the 20 archives from the max-history=100 run, with max-history=2 and logging switched off so that no rollover could happen, left all 20 in place; the same restart with clean-history-on-start=true deleted every one of them.
Custom configuration with logback-spring.xml
The logging.* properties cover most needs. When you need more — different appenders per environment, an appender Boot has no property for, levels that differ per profile — you write Logback XML yourself. Put it in src/main/resources/logback-spring.xml:
<?xml version="1.0" encoding="UTF-8"?>
<configuration>

    <springProperty name="APP_NAME" source="spring.application.name" defaultValue="app"/>

    <appender name="CONSOLE" class="ch.qos.logback.core.ConsoleAppender">
        <encoder>
            <pattern>%d{HH:mm:ss.SSS} %-5level [${APP_NAME}] %logger{36} - %msg%n</pattern>
        </encoder>
    </appender>

    <springProfile name="dev">
        <logger name="com.example.demo" level="DEBUG"/>
        <root level="INFO">
            <appender-ref ref="CONSOLE"/>
        </root>
    </springProfile>

    <springProfile name="!dev">
        <appender name="FILE" class="ch.qos.logback.core.rolling.RollingFileAppender">
            <file>logs/${APP_NAME}.log</file>
            <rollingPolicy class="ch.qos.logback.core.rolling.SizeAndTimeBasedRollingPolicy">
                <fileNamePattern>logs/${APP_NAME}.%d{yyyy-MM-dd}.%i.log.gz</fileNamePattern>
                <maxFileSize>10MB</maxFileSize>
                <maxHistory>14</maxHistory>
                <totalSizeCap>1GB</totalSizeCap>
            </rollingPolicy>
            <encoder>
                <pattern>%d{yyyy-MM-dd'T'HH:mm:ss.SSSXXX} %-5level [%thread] %logger : %msg%n</pattern>
            </encoder>
        </appender>
        <root level="WARN">
            <appender-ref ref="CONSOLE"/>
            <appender-ref ref="FILE"/>
        </root>
    </springProfile>

</configuration>
The two elements that start with spring are Boot extensions, not Logback:
<springProperty>copies a value out of Boot'sEnvironmentinto a Logback variable.application.propertiescontainsspring.application.name=demo, so${APP_NAME}becomesdemoin the console pattern and in the file name.<springProfile>includes its contents only when the profile expression matches.devis the local setup: DEBUG for the application, console only.!devcovers every other profile, including none at all: WARN, console and a rolling file.
The FILE appender lives inside the !dev block on purpose. In an earlier version it sat at the top level, and a dev run printed Appender named [FILE] not referenced. Skipping further processing. at startup — Logback 1.5.38 skips appenders that nothing references, and says so.
Running with --spring.profiles.active=dev:
14:47:56.464 DEBUG [demo] com.example.demo.DemoApplication - Running with Spring Boot v4.1.1, Spring v7.0.9
14:47:56.464 INFO  [demo] com.example.demo.DemoApplication - The following 1 profile is active: "dev"
14:47:56.661 INFO  [demo] com.example.demo.DemoApplication - Started DemoApplication in 0.377 seconds (process running for 0.553)
14:47:56.662 DEBUG [demo] c.example.demo.orders.OrderService - Reserving stock for order A-1001
14:47:56.663 INFO  [demo] c.example.demo.orders.OrderService - Order A-1001 placed
14:47:56.663 DEBUG [demo] c.e.demo.billing.BillingService - Calling payment gateway for order A-1001
14:47:56.663 INFO  [demo] c.e.demo.billing.BillingService - Charged 2500000 VND for order A-1001
14:47:56.663 WARN  [demo] c.e.demo.billing.BillingService - Large payment of 2500000 VND for order A-1001
The custom pattern with [demo] from <springProperty>, DEBUG lines from the application, and no logs directory created. The same jar with --spring.profiles.active=prod printed a single line to the console:
14:47:57.253 WARN [demo] c.e.demo.billing.BillingService - Large payment of 2500000 VND for order A-1001and wrote the same event to logs/demo.log in the file pattern:
2026-09-11T14:47:57.253+07:00 WARN [main] com.example.demo.billing.BillingService : Large payment of 2500000 VND for order A-1001Two interactions with the properties from earlier sections, both checked with the prod profile. logging.level.* still applies on top of your XML: adding --logging.level.com.example.demo.orders=DEBUG brought the Reserving stock DEBUG line back despite the WARN root. logging.file.name does not: --logging.file.name=other.log created no other.log, because this XML never references Boot's ${LOG_FILE} variable.
Why a plain logback.xml loads too early
Logback searches the classpath for logback.xml on its own, the moment the first logger is created — before Spring Boot has read application.properties or decided which profiles are active. At that moment nobody has taught Logback what <springProfile> means. Copying the exact file above to logback.xml instead and running with dev printed Logback's status report before anything else, including:
14:47:58,421 |-WARN in ch.qos.logback.core.model.processor.ImplicitModelHandler - Ignoring unknown property [springProperty] in [ch.qos.logback.classic.LoggerContext]
14:47:58,421 |-WARN in ch.qos.logback.core.model.processor.ImplicitModelHandler - Ignoring unknown property [springProfile] in [ch.qos.logback.classic.LoggerContext]
14:47:58,421 |-WARN in ch.qos.logback.core.model.processor.ImplicitModelHandler - Ignoring unknown property [springProfile] in [ch.qos.logback.classic.LoggerContext]
14:47:58,423 |-INFO in ch.qos.logback.core.model.processor.ModelInterpretationContext@47af7f3d - value "logs/APP_NAME_IS_UNDEFINED.log" substituted for "logs/${APP_NAME}.log"
14:47:58,424 |-WARN in ch.qos.logback.core.model.processor.AppenderModelHandler - Appender named [CONSOLE] not referenced. Skipping further processing.
Both springProfile blocks were ignored, APP_NAME was undefined, and the first configuration had no root appender at all. Boot then loaded the same file a second time with its extensions, so the rest of the output matched logback-spring.xml. The warning dump, the unconfigured window at startup and the reliance on a second pass are exactly what the -spring name avoids: Boot finds logback-spring.xml itself, and Logback never looks at it on its own.
MDC: adding a request id to every log line
When twenty requests run at once, their log lines interleave, and a line from BillingService no longer tells you which request it belongs to. SLF4J's MDC (Mapped Diagnostic Context) is a per-thread map of values that the pattern can print on every line. A servlet filter is the natural place to fill it:
@Component
public class RequestIdFilter extends OncePerRequestFilter {

    @Override
    protected void doFilterInternal(HttpServletRequest request, HttpServletResponse response,
            FilterChain chain) throws ServletException, IOException {
        String requestId = UUID.randomUUID().toString().substring(0, 8);
        MDC.put("requestId", requestId);
        try {
            chain.doFilter(request, response);
        } finally {
            MDC.remove("requestId");
        }
    }
}
The finally is not optional. Tomcat serves requests from a pool of threads — the nio-8094-exec-1 in the log lines — and MDC values belong to the thread, so a value that is never removed is still there when the same thread picks up the next request. %X{requestId} prints the value:
logging.pattern.console=%d{HH:mm:ss.SSS} %5p [%X{requestId}] %-40.40logger{39} : %m%nTwo requests, to /orders/A-1001 and /orders/A-1002, where the controller calls both services:
14:47:21.222  INFO [] com.example.demo.DemoApplication         : Started DemoApplication in 0.527 seconds (process running for 0.705)
14:47:21.326  INFO [fbd2ced0] com.example.demo.orders.OrderService     : Order A-1001 placed
14:47:21.326  INFO [fbd2ced0] c.example.demo.billing.BillingService    : Charged 450000 VND for order A-1001
14:47:21.338  INFO [afd9dadb] com.example.demo.orders.OrderService     : Order A-1002 placed
14:47:21.338  INFO [afd9dadb] c.example.demo.billing.BillingService    : Charged 450000 VND for order A-1002
Outside a request the brackets are empty. If you would rather keep Boot's layout, logging.pattern.level=%5p [%X{requestId}] slips the value in next to the level:
2026-09-11T14:47:22.922+07:00 INFO [e53e7983] 48689 --- [demo] [nio-8094-exec-1] com.example.demo.orders.OrderService : Order A-1003 placedThis is MDC at its simplest. Trace and span ids that follow a request across services are the job of Micrometer Tracing, covered in the Advanced course.
Switching from Logback to Log4j2
Because your code only talks to SLF4J, replacing Logback with Log4j2 is a build.gradle change:
configurations {
    all {
        exclude group: 'org.springframework.boot', module: 'spring-boot-starter-logging'
    }
}

dependencies {
    implementation 'org.springframework.boot:spring-boot-starter-webmvc'
    implementation 'org.springframework.boot:spring-boot-starter-log4j2'
    testImplementation 'org.springframework.boot:spring-boot-starter-webmvc-test'
    testRuntimeOnly 'org.junit.platform:junit-platform-launcher'
}
The exclusion goes on configurations.all rather than on one dependency because spring-boot-starter-logging arrives by several routes. gradle dependencyInsight on the test classpath shows it reaching the project through spring-boot-starter-webmvc, spring-boot-starter-jackson, spring-boot-starter-tomcat and spring-boot-starter-test; excluding it from the web starter alone would leave it on the test classpath.
After the change the runtime tree has no logback, jul-to-slf4j or log4j-to-slf4j left, and the new starter brings:
\--- org.springframework.boot:spring-boot-starter-log4j2 -> 4.1.1
     +--- org.apache.logging.log4j:log4j-slf4j2-impl:2.25.5
     |    +--- org.apache.logging.log4j:log4j-api:2.25.5
     |    +--- org.slf4j:slf4j-api:2.0.17 -> 2.0.18
     |    \--- org.apache.logging.log4j:log4j-core:2.25.5
     |         \--- org.apache.logging.log4j:log4j-api:2.25.5
     +--- org.apache.logging.log4j:log4j-core:2.25.5 (*)
     \--- org.apache.logging.log4j:log4j-jul:2.25.5
          \--- org.apache.logging.log4j:log4j-api:2.25.5
The direction has flipped: log4j-slf4j2-impl routes SLF4J calls into Log4j2, and log4j-jul does the same for JUL. The unchanged BridgeDemo now prints:
2026-09-11T14:46:02.829+07:00  INFO 47869 --- [demo] [           main] c.e.d.BridgeDemo                         : hello from the SLF4J API
2026-09-11T14:46:02.830+07:00  INFO 47869 --- [demo] [           main] c.l.JulClient                            : hello from java.util.logging
2026-09-11T14:46:02.830+07:00  INFO 47869 --- [demo] [           main] c.l.Log4jClient                          : hello from the Log4j API
2026-09-11T14:46:02.830+07:00  INFO 47869 --- [demo] [           main] c.l.JclClient                            : hello from Commons Logging
SLF4J ILoggerFactory : org.apache.logging.slf4j.Log4jLoggerFactory
Log4j API logger     : org.apache.logging.log4j.core.Logger
Commons Logging Log  : org.apache.commons.logging.impl.Log4jApiLogFactory$Log4j2Log
JUL root handlers    : [org.apache.logging.log4j.jul.Log4jBridgeHandler@537c8c7e]
Boot's LoggingSystem bean is now Log4J2LoggingSystem. The visible difference is the logger column: Boot's log4j2.xml uses %-40.40c{1.}, which shortens every package to one letter. logging.level.* keeps working — logging.level.com.example.demo.billing=DEBUG printed the Calling payment gateway line under Log4j2 — and the rotation properties move to the logging.log4j2.rollingpolicy.* prefix.
Adding Log4j2 without excluding Logback
Adding spring-boot-starter-log4j2 and forgetting the configurations block leaves both stacks in the jar: unzip -l lists logback-classic-1.5.38.jar, log4j-to-slf4j-2.25.5.jar and log4j-slf4j2-impl-2.25.5.jar side by side in BOOT-INF/lib. The application does not start:
SLF4J(W): Class path contains multiple SLF4J providers.
SLF4J(W): Found provider [org.apache.logging.slf4j.SLF4JServiceProvider@2b552920]
SLF4J(W): Found provider [ch.qos.logback.classic.spi.LogbackServiceProvider@2758fe70]
SLF4J(W): See https://www.slf4j.org/codes.html#multiple_bindings for an explanation.
SLF4J(I): Actual provider is of type [org.apache.logging.slf4j.SLF4JServiceProvider@2b552920]
followed, at the bottom of the exception chain, by:
Caused by: org.apache.logging.log4j.LoggingException: log4j-slf4j2-impl cannot be present with log4j-to-slf4j
	at org.apache.logging.slf4j.Log4jLoggerFactory.validateContext(Log4jLoggerFactory.java:67)
	at org.apache.logging.slf4j.Log4jLoggerFactory.newLogger(Log4jLoggerFactory.java:49)
	at org.apache.logging.slf4j.Log4jLoggerFactory.newLogger(Log4jLoggerFactory.java:32)
	at org.apache.logging.log4j.spi.AbstractLoggerAdapter.getLogger(AbstractLoggerAdapter.java:52)
	at org.apache.logging.slf4j.Log4jLoggerFactory.getLogger(Log4jLoggerFactory.java:32)
	at org.slf4j.LoggerFactory.getLogger(LoggerFactory.java:447)
	at org.apache.commons.logging.impl.Slf4jLogFactory.lambda$getInstance$0(Slf4jLogFactory.java:294)
	at java.base/java.util.concurrent.ConcurrentHashMap.computeIfAbsent(ConcurrentHashMap.java:1708)
	at org.apache.commons.logging.impl.Slf4jLogFactory.getInstance(Slf4jLogFactory.java:293)
	at org.apache.commons.logging.impl.Slf4jLogFactory.getInstance(Slf4jLogFactory.java:288)
	at org.apache.commons.logging.LogFactory.getLog(LogFactory.java:921)
	at org.springframework.boot.SpringApplication.<clinit>(SpringApplication.java:205)
	... 6 more
Read it in two parts. First, SLF4J found two providers and simply took the first one on the classpath — here Log4j's, which is an accident of ordering rather than a decision. Second, log4j-to-slf4j sends Log4j API calls to SLF4J while log4j-slf4j2-impl sends SLF4J calls to the Log4j API; together they would pass every event around in a circle, so Log4j refuses to start. The failure happens inside SpringApplication's static initialiser, before Boot has a logging system to report anything through. When you see multiple SLF4J providers, run gradle dependencies and remove one side.
Structured JSON logging
Boot 4.1.1 can also write each event as a single JSON object instead of a formatted line, which is what log collectors want to parse. logging.structured.format.console (and logging.structured.format.file) accepts ecs, gelf or logstash; with ecs, each line became an object with @timestamp, log.level, log.logger, process.pid, service.name and message fields. Choosing a format, adding fields and shipping the output belong to the observability chapter of the Advanced course.
The logging.* properties used in this article
| Property | What it does | Default |
|---|---|---|
logging.level.<logger> | level for a logger and every logger below it; root for the top of the tree | root INFO |
logging.group.<name> | defines a group of loggers that logging.level.<name> sets together | built-in web and sql |
logging.pattern.console | replaces the whole console pattern | Boot's CONSOLE_LOG_PATTERN |
logging.pattern.dateformat | only the date part of Boot's patterns | yyyy-MM-dd'T'HH:mm:ss.SSSXXX |
logging.pattern.level | only the level part of Boot's patterns | %5p |
logging.file.name | writes to this file, relative to the working directory | none |
logging.file.path | writes spring.log in this directory; ignored when logging.file.name is set | none |
logging.logback.rollingpolicy.max-file-size | size at which the active file rolls over | 10MB |
logging.logback.rollingpolicy.total-size-cap | total size of archives before the oldest are deleted | 0B, no cap |
logging.logback.rollingpolicy.max-history | number of %d periods of archives to keep, not files | 7 |
logging.logback.rollingpolicy.file-name-pattern | archive name: %d sets the period, %i the index, .gz enables compression | ${LOG_FILE}.%d{yyyy-MM-dd}.%i.gz |
logging.logback.rollingpolicy.clean-history-on-start | also deletes expired archives at startup | false |
logging.structured.format.console | JSON output for the console: ecs, gelf or logstash | none |
spring.output.ansi.enabled | colour codes: detect, always or never | detect |
debug / trace | the --debug and --trace switches as properties | false |
FAQ
Where does Spring Boot write logs by default?
To the console only, at INFO for the root logger, in the pattern from defaults.xml. No file is written until you set logging.file.name or logging.file.path. Once you do, the console keeps printing and the file receives the same events in the file pattern.
What is the difference between SLF4J and Logback?
SLF4J is the API your code calls: Logger, LoggerFactory, MDC. Logback is the implementation behind it that checks levels, formats lines and writes them to appenders. Libraries depend on SLF4J so they never force an implementation on you, and Spring Boot's default implementation is Logback 1.5.38.
Why is log.debug() not printing in Spring Boot?
Because the root level is INFO and your package inherits it. Set logging.level.com.yourcompany=DEBUG, or a more specific package. --debug does not help: it raises only a fixed set of framework loggers, and com.example.demo stayed at INFO when it was measured above. If a more specific logger is set higher, for example logging.level.com.yourcompany.billing=WARN, that setting wins for its subtree.
Should I use logback.xml or logback-spring.xml?
logback-spring.xml. Logback reads logback.xml by itself before Spring Boot is ready, so <springProfile> and <springProperty> are ignored on that first pass, with warnings. Boot loads logback-spring.xml itself, after the environment and profiles are known, so its extensions work.
Why does max-history not limit the number of log files?
It counts periods of the %d date pattern, not files. With Boot's daily pattern, max-history=7 keeps about a week of archives however many files each day produces; in the per-second test above, max-history=2 left eight files. To cap disk usage, set logging.logback.rollingpolicy.total-size-cap.
Can I change the log level without restarting the application?
Not with logging.level.*, which is applied at startup. Spring Boot Actuator exposes a loggers endpoint that reads and changes levels in a running application; Actuator is covered in Chapter 7.
Conclusion
Logging in Spring Boot is one pipeline with a clear division of labour. Your code and your libraries call an API — SLF4J directly, or JUL, the Log4j API and Commons Logging through bridges and adapters — and Logback decides what is printed and where. Levels are inherited down a tree of logger names, so logging.level.<package> and log groups control whole areas at once, while --debug and --trace only touch framework loggers. The default line packs timestamp, level, PID, application name, thread and an abbreviated logger into a pattern you can override field by field. logging.file.name adds a file that rotates by size and date, where max-history counts periods and total-size-cap is what really bounds the disk. When properties are not enough, logback-spring.xml adds profile-aware configuration, and because the code only knows SLF4J, even Log4j2 is a build file change away — provided Logback leaves the classpath.
That closes Chapter 2. Chapter 3 moves from how the application runs to what it offers the outside world, and it starts with the ground rules every API depends on: HTTP and REST fundamentals — methods, status codes and RESTful URL design.
![[Spring Boot Basics] Validation in Spring Boot: Bean Validation Annotations, @Valid and Custom Validators](/images/blog/sb-validation-thumbnail.en.webp)
![[Spring Boot Basics] Setting Up Spring Boot: JDK, IDE, Spring Initializr and Your First Application](/images/blog/sb-setup-thumbnail.en.webp)
![[Spring Boot Basics] Java Prerequisites for Spring Boot: OOP, Generics, Streams, Records and Annotations](/images/blog/sb-prerequisites-thumbnail.en.webp)
![[Spring Boot Basics] API Documentation in Spring Boot with springdoc-openapi and Swagger UI](/images/blog/sb-springdoc-thumbnail.en.webp)